U.S. Pecan Trade and Tariff Outlook

U.S. Pecan Production. (Figure provided by Landyn K. Young and Luis A. Ribera)
In 2024, U.S. pecan production totaled 120 thousand metric tons (TMT), the state with the largest production volume was Georgia with 46.3 TMT. Since 2020, Georgia has accounted for 33-56 percent of all pecans grown in the United States. New Mexico (38.5 TMT) follows around 10 TMT of annual production lower and was the source of 31-41 percent of U.S. grown pecans. The three remaining states with reported production in 2024 together totaled less than New Mexico in 2024 and since 2020 have grown between 29-36 percent of U.S. pecans.
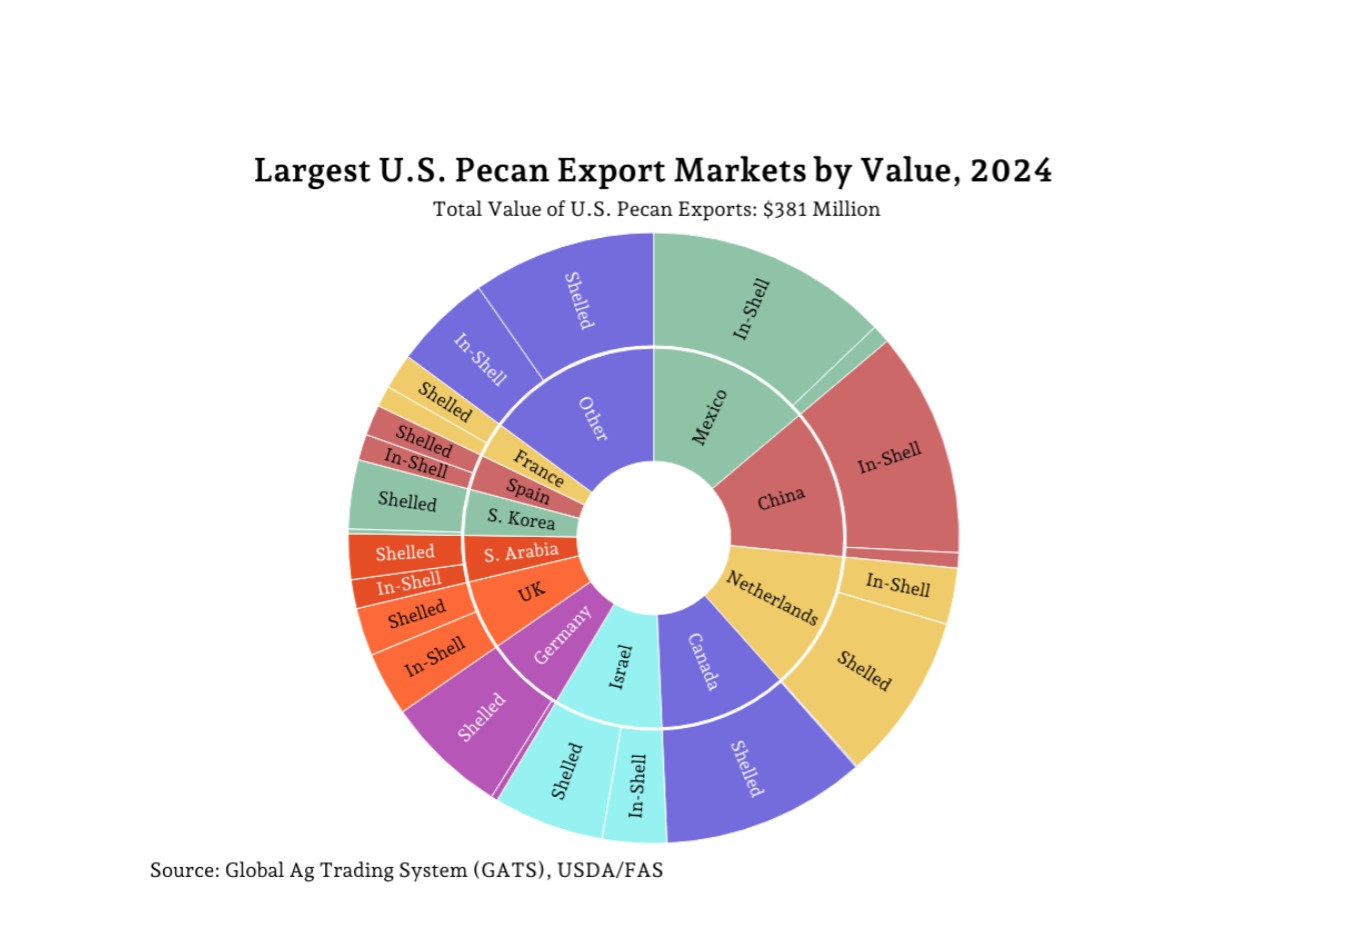
Pecan Exports. (Figure provided by Landyn K. Young and Luis A. Ribera)
Exports of Pecans from the United States totaled 53.7 TMT worth a total of $381 million. Of this in-shell pecans accounted for 32.2 TMT and $169.2 million, the remaining 21.5 TMT and $211.8 million of exports were shelled. In-shell exports to Mexico and China accounted for $94.5 million in 2024, or 75.8 percent of the total volume of in-shell exports. The market for shelled pecans is less consolidated with the top five importers accounting for 63.7 percent of U.S. shelled pecan exports or $135.7 million of the total value. In 2024, Canada was the largest destination for U.S. shelled pecans at 18.4 percent followed by the Netherlands (16.3%), Germany (12.1%), Israel (10.5%), and South Korea (6.4%).
U.S. Imports
Due to ease of access to low-cost labor in Mexico, much of the volume of in-shell pecans exported to Mexico will be shelled and then imported back to the United States to either be sold domestically or packaged and exported elsewhere. This makes Mexico far and away largest market for U.S. pecan imports.
During 2024, 60.7 TMT of pecans were imported worth a value of $493.9 million. That year, the United States imported 16.6 TMT of in-shell pecans worth $64.4 million and 44 TMT of shelled pecans worth $429.4 million. Imports from Mexico accounted for 99.7 percent of in-shell imports and 99.5 percent of shelled imports. U.S. pecan imports from the rest of the world combined for 1.95 TMT of shelled pecans and less than 100 MT of in-shell pecans.
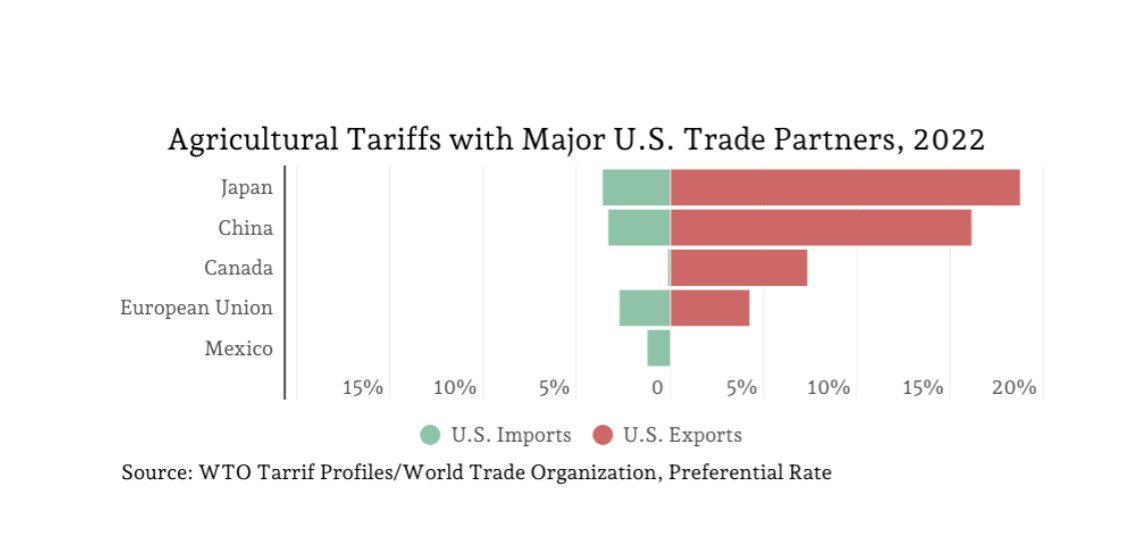
Ag. Tariffs with U.S. Trade Partners in 2022. (Figure provided by Landyn K. Young and Luis A. Ribera)
In the 2010’s, the import volume of in-shell and shelled pecans was relatively even. Since, there has been a shift with the disparity between the two product groups has growing. Shelled pecan imports leaped up in 2018 and has remained about the same since, while in-shell imports fell annually from 2018-2022, reaching their lowest import volume at 11.8 TMT. In 2016 the split between import volumes was 53.1 percent shelled and 47.9 percent in-shell, this divide grew to 78.8 percent shelled in 2022.
U.S. Tariffs on Mexico
The North American Free Trade Agreement (NAFTA) went into effect in 1994 and worked to lower trade barriers between the three countries apart of the deal, this was renewed recently in 2020 as the United States-Mexico-Canada Agreement (USMCA). Under these agreements, tariffs were brought down drastically and trade between the member countries increased. During 2022, the preferential tariff rate on agricultural products traded between the United States and Mexico was zero on U.S. exports to Mexico and 1.2 percent on U.S. imports. Preferential tariff rate is trade-weighted average of the lowest existing tariff lines between countries; this means it takes the lower of the most favorite nation (MFN) rate or any existing trade agreements between countries.
Through the previously mentioned free trade agreements, tariffs on pecan trade between the United States and Mexico were set at zero percent. Despite this, there are still barriers in place between the two countries for pecan trade, specifically in-shell pecans. This does not account for non-tariff barriers to trade which include sanitary and phytosanitary (SPS) restrictions, technical barriers to trade, safeguards, anti-dumping, and counter-veiling policies. These non-tariff measures (NTM) have a major impact on trade that is difficult to quantify. Since 2004, the NTMs for all WTO countries have nearly quadrupled from 5.3 thousand measures to 19 thousand. The largest NTM category is SPS restrictions.
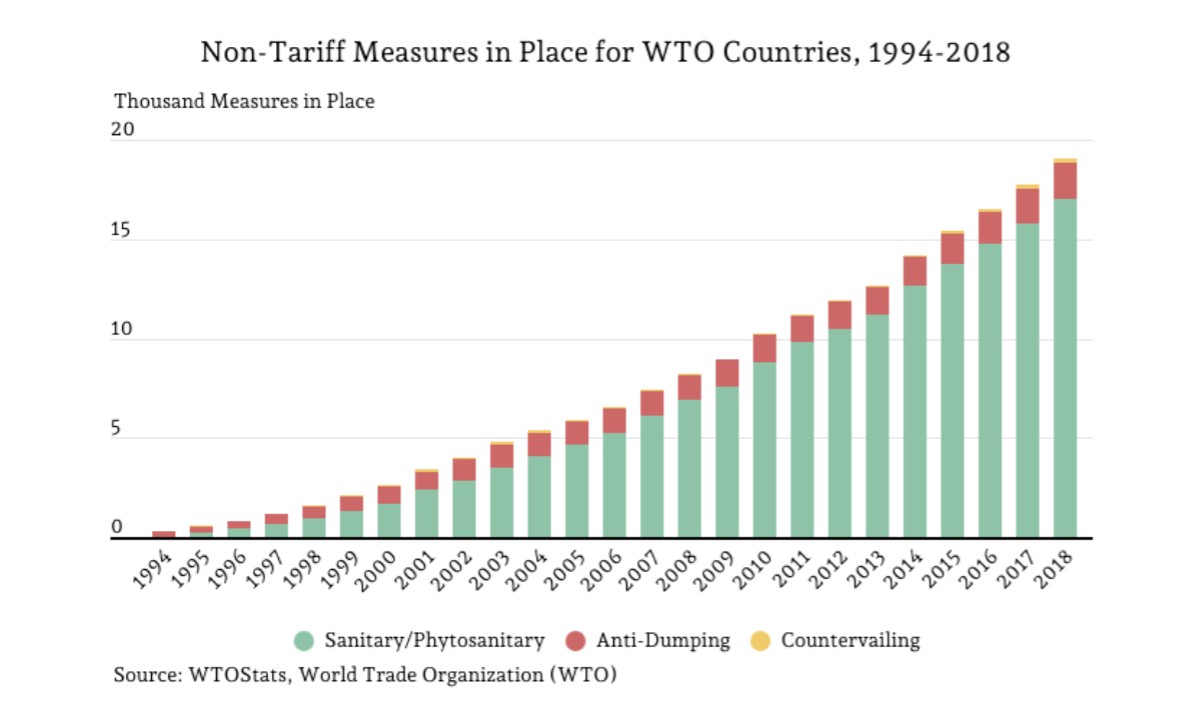
Non-Tariff Measures from 1994-2018. (Figure provided by Landyn K. Young and Luis A. Ribera)
One such SPS measure inhibiting U.S. exports is the pecan weevil quarantine. Mexico requires that pecans grown outside of their designated quarantine zone in the United States to have both a phytosanitary certificate and import permit if they are exported in-shell. Arizona, California, New Mexico (except for Otero County), and six counties near the El Paso region in Texas fall outside of the pecan weevil quarantine zone. Mexico requires that all pecan exports from the non-quarantine zones to receive treatment for pecan weevils, either cold storage or fumigation. While the Texas Department of Agriculture also has a quarantine on pecan weevils, once one of the four approved treatment options has been completed the product is free to travel across state borders. That is not that case with exports to Mexico which requires non-quarantined pecans to be treated and will not allow any pecans from quarantine areas.
In February, it was announced that a 25 percent tariff would be placed on both USMCA partner countries, this applies to all products including agricultural imports. Thus, the tariff rate on imported pecans, which is primarily shelled, from Mexico from zero percent to 25 percent. With U.S. pecan imports coming from Mexico totaling over 99.5 percent of the total from the world for both shelled and in-shell, other import tariffs have little impact comparatively. It is very difficult to predict the actual impact of the 25 percent tariff but somewhere along the supply chain the extra cost will have to be paid and oftentimes the lion’s share falls onto the consumer. In addition, if the NTMs from Mexico are still in place that would also impact negatively the trade between both countries.
References
Kee, Hiau Looi, Alessandro Nicita and Marcelo Olarreaga. “Estimating trade restrictiveness indices”, Economic Journal, 2009, vol. 119, p. 172–199.
Foreign Agricultural Service (FAS). Global Agricultural Trade System (GATS). Online database. https://apps.fas.usda.gov/gats/default.aspx. Online public database accessed August 2025.
USDA Animal and Plant Health Inspection Service (APHIS). Phytosanitary Export Database (PExD) with Requirements by Country. https://pcit.aphis.usda.gov/PExD/faces/ViewPExD.jsp. Online public database accessed May 2025.
USDA National Agricultural Statistics Service (NASS). Quick Stats. https://www.nass.usda.gov accessed May 2025.
World Trade Organization. WTO Stats. https://stats.wto.org/. Online public database. Accessed April 2025.
World Bank Group. Overall Trade Restrictiveness Indices and Import Demand Elasticities. March 2018. Online public database.
