Pecan Zinc Deficiency Linked to Leaflets’ Zinc Levels
Pulled from the Pecan South archives, article originally appeared in Pecan South's September 1982 issue. Rewritten from a paper originally published in HortScience.
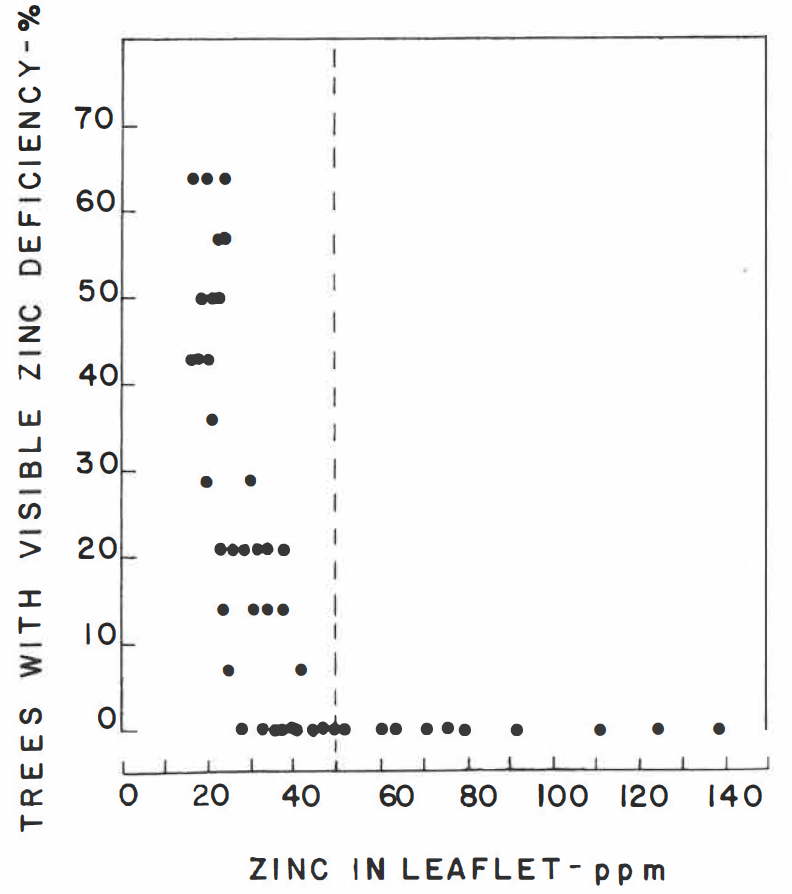
Figure 1. Relationship between percentage of pecan trees with zinc deficiency symptoms and parts per million zinc in the leaflet. The vertical broken line represents the lower limit (50 ppm) of the zinc sufficiency range. Each point is based on 14 trees. Based on an experiment with 10 differential zinc treatments over a six-year period.
LEAFLET ANALYSIS is widely used by pecan growers to determine the Zn (zinc) status of their pecan trees. In most diagnostic laboratories, the zinc concentration of the leaflet of 50 to 100 or 60 to 100 parts per million zinc is considered sufficient. 1,4,10 Pecan trees with less than 20 ppm Zn in the leaflets are zinc deficient.6 Thus, the reported sufficiency ranges are well above the deficiency range. However, in practice, leaflet samples are usually composite samples which rarely contain only zinc-deficient leaflets. Therefore, zinc values of up to 40 parts per million have been reported for zinc-deficient trees.9,11
When zinc deficiency occurs under typical field conditions, composite samples include a mix of normal-looking and zinc-deficient leaflets. This is because zinc deficiency usually occurs only on part of the trees or on segments of individual trees. Among trees treated the same, one tree may show no deficiency symptoms, while an adjacent tree does. Within individual trees; only one small branch may show zinc deficiency and symptoms often appear first or are more severe in the upper parts of the canopy than in the lower parts. Growers usually take their samples from the lower canopy. Leaflet samples submitted by the growers may, therefore, contain leaflets of variable zinc status. Furthermore, zinc deficiency is rare in well-managed groves in the Southeast. Thus, these growers are more interested in preventing a zinc deficiency than in correcting it. Consequently, the reliability of the proposed sufficiency ranges is of utmost importance.
In this study, the reliability of the commonly accepted sufficiency range was tested by comparing the range to: a—the average zinc concentration in the leaflets of groups of trees where a variable percentage of the trees within the groups had zinc deficiency symptoms and b—to the average zinc concentration in the leaflets of trees grouped according to severity of zinc deficiency.
The data are based on mature pecan trees from a zinc uptake study conducted at the Southeastern Fruit and Tree Nut Research Station at Byron, Georgia. The study consisted predominantly of’ Stuart’ and ‘Schley’ trees. At the beginning of the study, zinc deficiency was widespread in the experimental grove. Ten zinc treatments were applied to the soil surface. Equivalent amounts of zinc per tree were applied to the soil surface on a broadcast and band basis. Broadcast rates were 0, 50, 100, 200, or 400 pounds of zinc sulfate per acre. Band rates were 0, 2.5, 5, 10, or 20 pounds of zinc sulfate per acre applied in a 6-inch wide band around the tree. Each treatment was applied to 14 trees. Zinc uptake from the various treatments was followed for six consecutive years by annually collecting leaflet samples from the lower canopy1,8 and analyzing them for Zinc.5
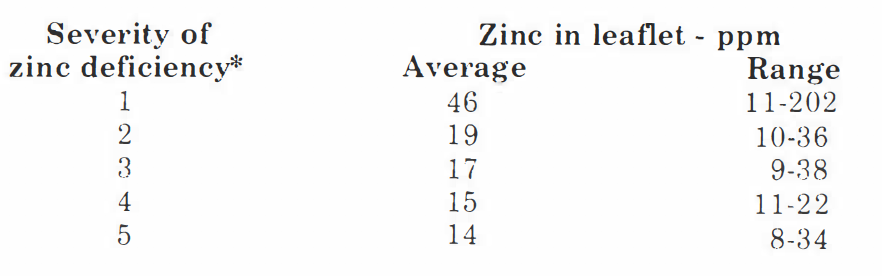
Table 1. Severity of zinc deficiency symptoms of pecan trees versus average concentration and range in zinc concentration in the leaflet.
Leaf sampling was standard with respect to sampling procedure1 and time.8 Sampling consisted of taking the middle pair of leaflets from the mid-portion of the shoot.1 Leaflets were sampled from this position regardless of the presence or absence of zinc deficiency. At the time of leaf sampling, visual zinc deficiency symptoms (interveinal chlorosis) were recorded by tree as follows:
- 1 = no zinc deficiency;
- 2 = zinc deficiency difficult to find;
- 3 = less than 25 percent of the canopy with zinc deficiency;
- 4 = more than 25 percent but less than 50 percent of the canopy showing zinc deficiency;
- 5 = more than 50 percent of the canopy showing zinc deficiency symptoms.
During the first year of the study, some trees in all treatments had zinc deficiency. As the applied zinc was taken up, the zinc deficiency was corrected in most treatments. Thus, during the six years of the study, there was a wide range in the percentage of deficient trees and their average zinc concentration within treatments. The range is assumed to be similar to that found in commercial groves.
The percentage of trees with zinc deficiency decreased with increasing zinc concentration in the leaflet (Figure 1). In trees grouped according to severity of zinc deficiency, zinc in the leaflet increased with decreasing severity (Table 1). In both situations, there were no zinc deficiency symptoms when mean zinc concentration in the leaflet was 50 parts per million or above. Except for one case (Figure 1), zinc deficiency occurred only when the mean zinc concentration was less than 40 parts per million.
Based on visual deficiency symptoms, these data (Figure 1 and Table 1) indicate that the sufficiency range of 50 to 100 parts per million zinc2 is adequate. The adequacy of this range is further substantiated by yield data. Nut yield has not been increased beyond the visual deficiency range2 or when zinc concentration in the leaf exceeded 36 parts per million.3 Thus, the proposed sufficiency range of 50 to 100 parts per million zinc in the leaf is an adequate level of zinc for pecans.
