Back to June 2025


The Returns to On-Farm Hedging
In our first article of this series, we indicated that we would explore the economics of adopting on-farm operations, including hedging, shredding, and harvesting. In that article, we introduced capital budgeting, a framework for evaluating investments that are generally significant in terms of their cost and expected useful life. Additionally, we described the measures of return often used in capital budgeting, including payback periods, net present value, and the internal rate of return. In this article, we explore the economics of hedging or pruning.
Introduction
Pecan producers have adopted strategies that can improve pecan yields and quality. A strategy commonly utilized in Western states is mechanical hedging. Mechanical hedging uses specialized equipment to trim the tree canopy to a uniform height and shape. In small orchards, a lift with a basket can be used to hedge trees. The cost of a lift can range from as little as $20,000 or $30,000 for a pull-behind model to more than $100,000 for a self-propelled lift. Larger orchards require mechanical hedgers. These hedgers are much more expensive, in the hundreds of thousands of dollars.
Hedging can be used as a corrective measure or as a maintenance measure. Corrective hedging improves the tree’s structural health by removing damaged or weak branches and reducing overcrowding for more vigorous growth. Maintenance hedging focuses on enhancing the tree’s appearance, shaping it, and maintaining its size and uniformity. The use of corrective or maintenance hedging depends on the goals and needs of the orchard (Complete Tree Care, 2023).
There are a number of benefits associated with mechanical hedging. These included (Wells and Sawyer, 2023):
- Sunlight management. Sunlight exposure improves photosynthesis and supports healthy trees. Opening up the canopy to more sunlight allows producers to space trees closer. Without hedging, trees planted too closely will experience excessive shading, resulting in dead limbs.
- Foliar spray coverage. Orchards regularly require foliar sprays to provide tree nutrients and to control pests. Air-blast sprayers are used to deliver these essential inputs, but when trees are too tall or the canopy too dense, the application is not as effective.
- Pecan water status and quality. Reducing the percentage of large limbs that make up the tree’s structure allows the tree to focus its energy on canopy and nut development. Research indicates that hedge pecan trees have less water stress and better-quality nuts.
- Reduced storm damage. Many pecan-growing regions in the United States experience extreme weather events, including strong winds. These events have the potential to significantly damage trees, especially when they occur when trees are leafed out and bearing nuts. Hedging can improve tree performance and reduce damage in these cases.
Once established, maintenance hedging cycles are generally developed for three and four-year intervals. That is, cycles are developed such that one-third or one-fourth of the orchard is hedged each year. Hedging patterns, for example, hedging every second, third, or fourth row, can be used to facilitate the hedging cycle. For example, hedging every second row (every other row) would facilitate one-half of a two-year cycle of hedging, where the entire orchard is hedged in two years (Wells and Sawyer, 2023).
The Returns to On-Farm Hedging
The returns to on-farm hedging described in this paper are based on identifying the marginal savings between hiring a third-party provider and the costs of purchasing and hedging using labor provided by the producer. In this case, cash outflows used in the capital budgeting model are the costs associated with purchasing, maintaining, and operating the hedging equipment on the farm. Cash inflows are cost savings associated with not hiring a third-party provider. That is, the inflows are equal to the per-acre savings of contracting the hedging services.
Assumptions
There are a number of assumptions that must be made in order to identify cash inflows and outflows from the adoption of on-farm hedging. The value for these assumptions will vary depending on regional and producer characteristics. For example, from a regional difference perspective, the cost of having a third-party contractor hedge an orchard may vary. Additionally, the size of an orchard may also impact the cost of third-party contractor hedging. These differences are reflective of supply and demand conditions. An example of how assumptions may vary by producer is the discount rate. The discount rate is a measure of the time preference of money and is generally reflective of a producer’s cost of capital, both equity and debt. A producer’s cost of capital will vary on many factors, including those that affect their ability to borrow money as well as opportunity costs of alternative investments.
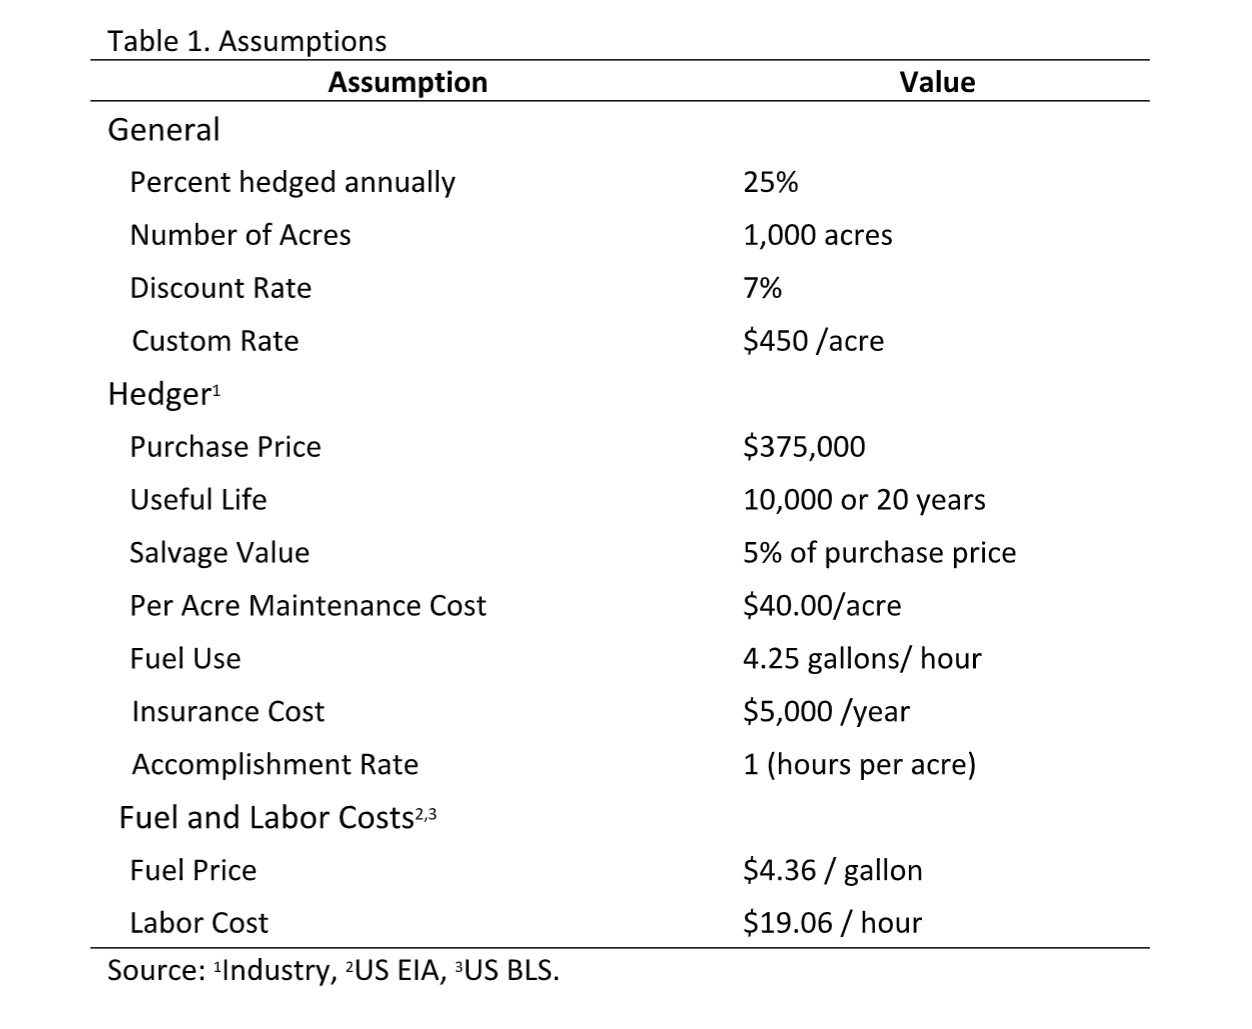
The assumptions described below are for a representative farm in southern New Mexico. These assumptions may or may not accurately reflect your particular situation. While the assumptions may not reflect your situation, they can be changed to reflect your realities better. Table 1 summarizes the assumptions made in the analysis.
Results
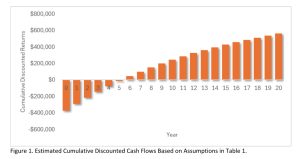
Based on the assumptions used in the model, the annual cost savings from adopting on-farm hedging is $112,500, calculated as $450 multiplied by 250 hedged acres. Annual cash costs associated with the on-farm hedging operations included costs for labor, fuel, insurance, and hedger maintenance. These costs were estimated to equal $24,398 annually. The net cash flows from adopting on-farm hedging, the difference between the third-party hedging cost of $112,500 and the on-farm operational costs of $24,398, were $88,103 per year. These annual “cost savings” can be used to pay for the hedger which was estimated to have a purchase price of $375,000. Figure 1 shows the estimated cumulative discounted cash flows assumed to occur over a 20-year life of the hedger.

Figure 1. Estimated Cumulative Discounted Cash Flows Based on Assumptions in Table 1.
A close observation of Figure 1 reveals that the initial investment of $375,000 had a discounted payback period of approximately 5.3 years (cumulative returns, negative in the fifth year, are positive in the sixth year). The simple payback period, not observable in Figure 1, is 4.3 years ($375,000 divided by annual cost savings of $88,103). The net present value of the investment, shown as ending value in year 20, is over $563,000. The corresponding internal rate of return was 23%. Based on these return measures and the assumptions in Table 1, a 1,000-acre orchard that hedges one-quarter of its trees annually could economically justify the investment in on-farm hedging.
The spreadsheet model used to analyze the investment in mechanical hedging can be used to identify the “break-even” acreage required to make the investment worthwhile from an economic standpoint for the investment to have a positive net present value. Using the “goal seek” feature in the spreadsheet, we find that the annual hedged acreage required for the investment to “break even,” in the sense that the net present value is zero, is 107 acres.
Sensitivity
As previously indicated, the results presented above rely heavily on the accuracy of the assumptions made in Table 1. The assumptions are likely to change depending on a particular producer’s circumstances. Sensitivity tables can help illustrate potential differences in returns from those presented above with changes in underlying assumptions. Tables 2, 3, and 4 show the investment’s net present value and internal rate of return when discount rates, reflective of a producer’s cost of capital, third-party custom rates, and initial purchase prices are varied. All assumptions, except those identified in the tables, remain at their initial levels.
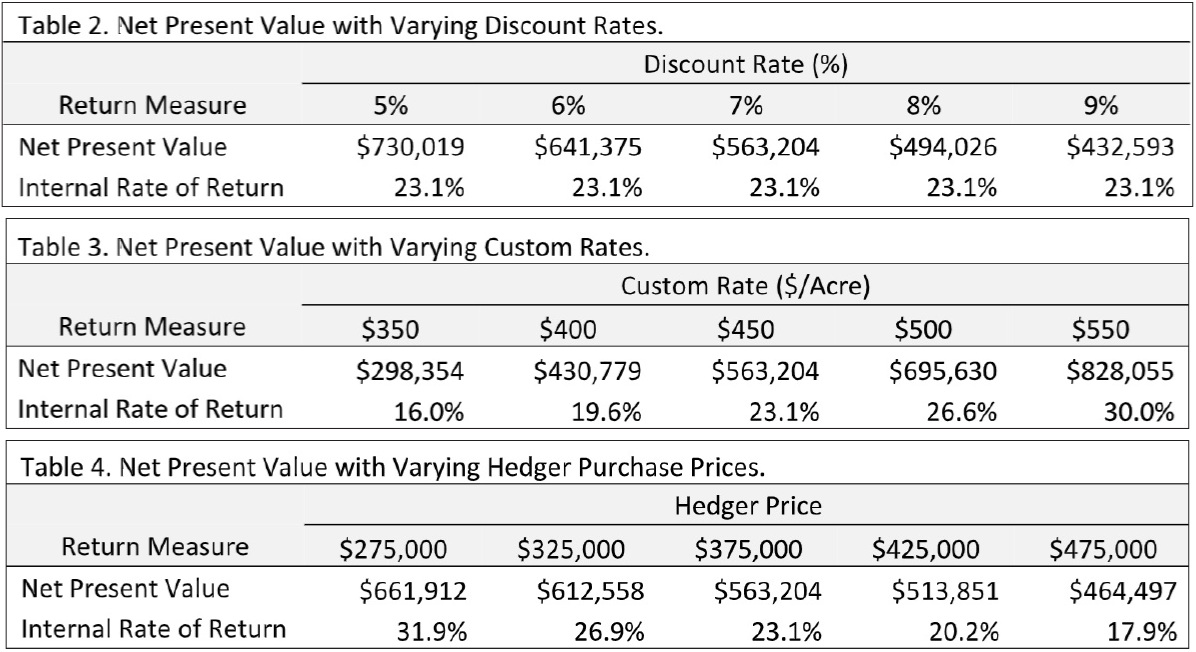
Tables 2,3 &4 with varying net values, rates, and prices.
Conclusion
Adoption of on-farm operations can provide benefits to producers, both quantifiable and those that are more difficult to quantify. For example, producers who choose to purchase and do their hedging have greater control over when hedging occurs. The analysis described in this article suggests, based on assumptions presented earlier, that on-farm hedging also has economic benefits. Producers should do their due diligence in determining if on-farm hedging makes sense for their operation. In addition to validating assumptions provided in this article, producers considering on-farm hedging should ensure that they have the expertise and sufficient resources to carry out operations.
References
Complete Tree Care. (2023, September 13). Corrective Pruning vs Maintenance Pruning: What’s the Difference? Retrieved from Complete Tree Care: https://www.acompletetreecare.com/blog/corrective-pruning-vs-maintenance-pruning-whats-the-difference/#:~:text=Corrective%20pruning%20and%20maintenance%20pruning%20are%20two%20distinct,
Wells, L and A. Sayer. “Hedge Pruning Pecan Trees with the Southeastern U.S.” University of Georgia Extension Bulletin 1557. October 2023. Available online https://secure.caes.uga.edu/extension/publications/files/pdf/B%201557_1.PDF. Accessed March 7, 2025.
Carmina Jaramillo Martinez, Chaddelle “Chaddy” Robinson & Jay Lillywhite
- Carmina Jaramillo Martinez is a Graduate Research Assistant in NMSU's Department of Agricultural Economics and Agricultural Business.
- "Chaddy" Robinson is an Associate Professor in the Department of Agricultural Economics and Agricultural Business at New Mexico State University. Her research interest aims to improve agricultural producers’ incomes by providing a better understanding of consumer behavior, market research, and general business operations and research.
- Dr. Jay Lillywhite is a professor and the department head in the Agricultural Economics and Agricultural Business Department at New Mexico State University. He specializes in agribusiness management and marketing. lillywhi@nmsu.edu