New Industry Data Shows More Pecans on the Move
The May 2020 Pecan Position Report presents further data on pecan's movement over the last month and throughout this crop year.
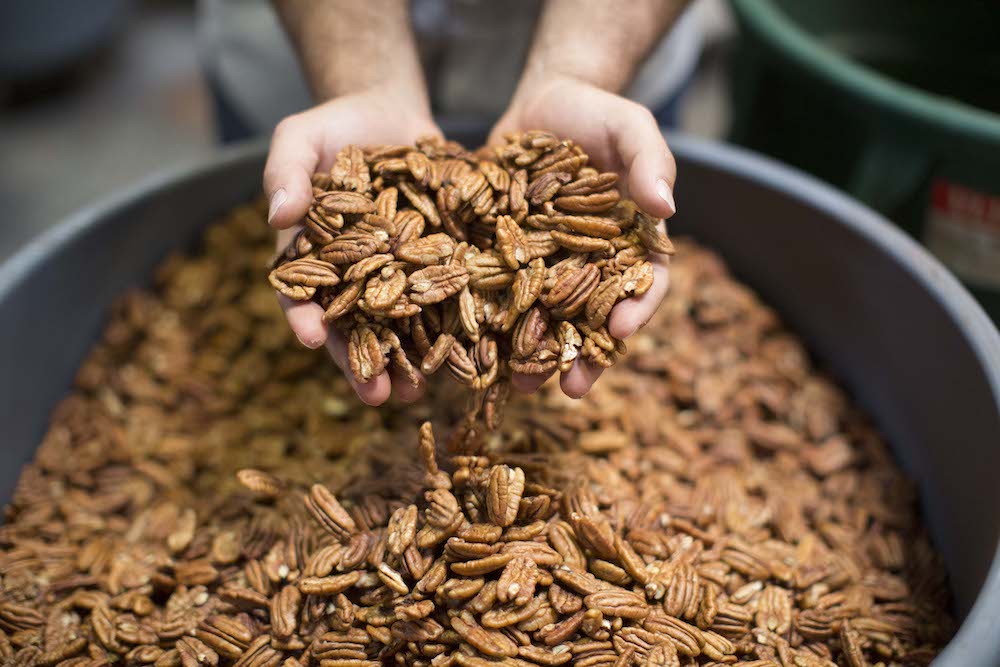
(Photo courtesy of APC)
Before diving into the data, it’s important to note that the APC updates the reports as more handlers submit forms. For instance, the February 2020 Position Report has been updated since Pecan South’s article on the subject. The new numbers can be found in this article’s accompanying charts or the report published on AmericanPecan.com.
Examining Pecan Exports
According to recent position reports, total U.S. pecan exports (inshell basis) hit their highest point for the current crop year in March, fell slightly during April, and then bounced back throughout May. Although this year’s peak did not reach the same level as that from the 2018-2019 crop year, exports are higher for these last three months than they were during this same time last year.
For this crop year, exports started at a higher point than they did the previous year but quickly fell below last year’s levels in October just as the United States seemed to be approaching trade deals with China, Japan, Mexico, and Canada.
The peak in March may seem surprising to those outside of the export business. As countries around the world entered into lockdown and took social distancing measures to combat the coronavirus outbreak, consumers began panic buying, and companies made purchases to meet consumers’ demands for versatile, nutrient-dense, and easily storable products—like pecans. April’s slight drop follows the lockdown pattern and may reflect the global economic downturn caused by the pandemic. May’s Position Report marks a rebound in total exports as countries began to open back up.
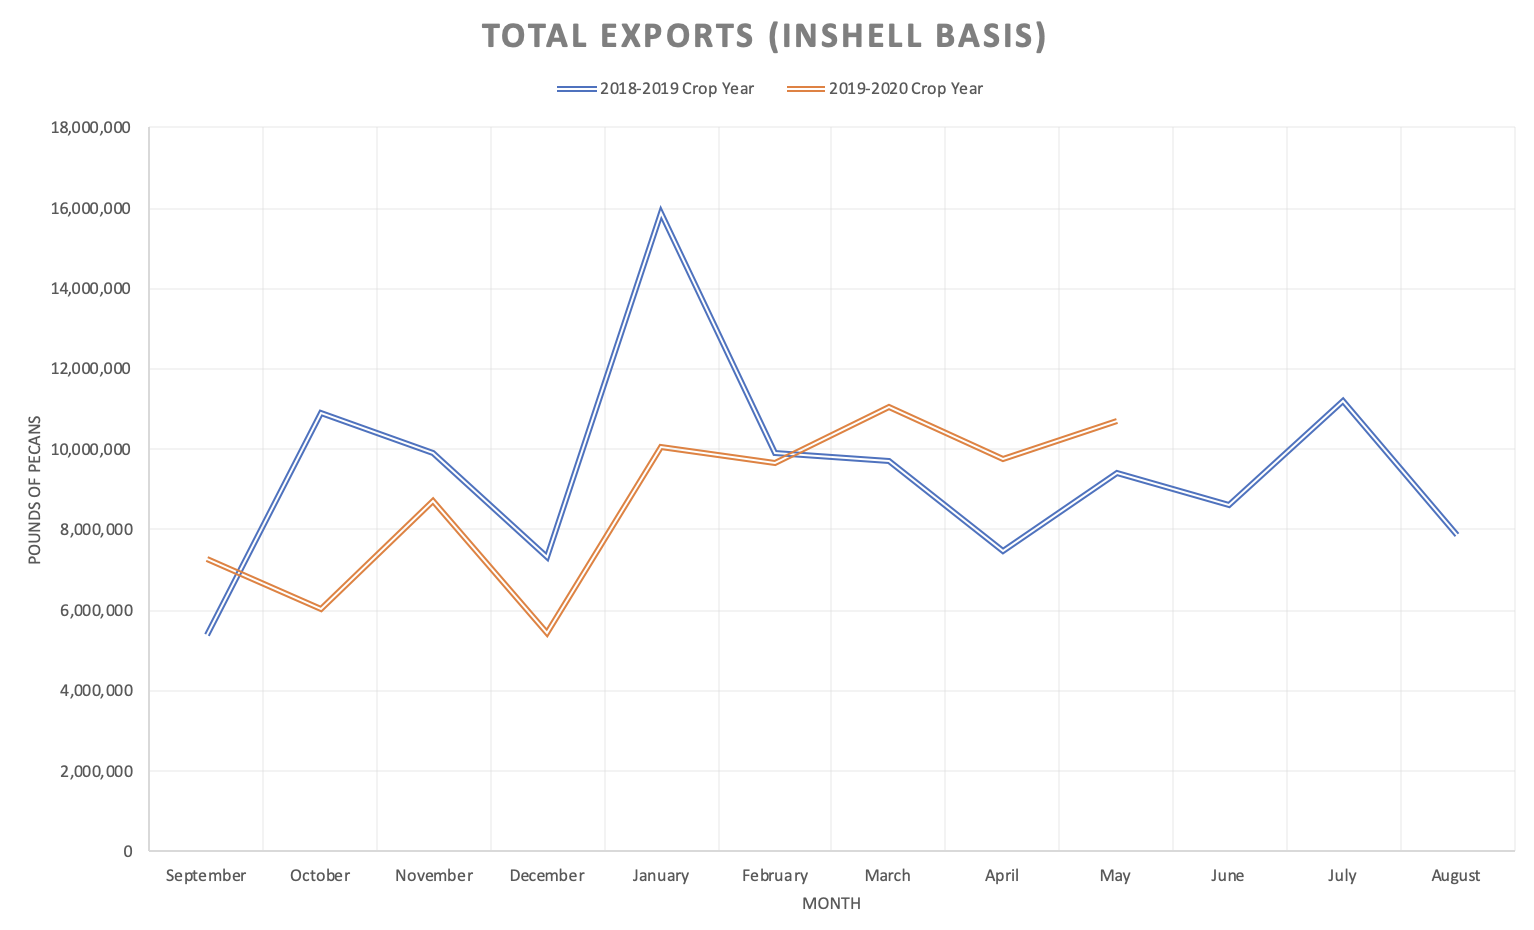
This graph uses data from the APC’s Pecan Industry Position Reports. Those individual reports can be found at americanpecan.com.
The fluctuation in exports somewhat reflects which countries were already in quarantine in March and those that were just entering into lockdown. Due to the lack of workers at ports, some exporters had to delay shipments until the summer months, and others had to take back loads that had already been sent out.
For example, exports to South Korea dropped in March, but loads headed to China and Hong Kong saw increases. In April, exports to South Korea and China increased.
At the same time, parts of Europe received an increase in shipments in March. Italy, for instance, received 0 pounds of pecans in February and 70,440 pounds (inshell basis) throughout March, even though the country was under lockdown for most of the month, and dropped back to zero in April. The April and March Position Reports both show an increase in total exports to Europe as a whole. This increase may mirror grocery stores and larger companies’ rush to meet consumers’ increased demand for staples and baked goods.
May’s Position Report provides another layer of data by including yearly comparisons for the first time; future reports will also include these comparisons. For instance, it reports that U.S. handlers exported a total of 16,389,306 pounds (inshell basis) of pecans to China received from Sept. 1, 2019 to May 31, 2020. In comparison, handlers shipped 3,494,596 pounds (inshell basis) from Sept. 1, 2018 to May 31, 2019. These numbers mark a 369 percent increase in exports to China for the current crop year.
According to the May Position Report, grand total shipments for the current crop year up to the end of May reached 79,017,025 pounds (inshell basis) which is below that from the previous year— 88,378,232 pounds. This decrease could be attributed to the U.S.-Chinese Trade War, which continued well into this year’s harvest, and the pandemic, which disrupted early exports.
Deconstructing Pecans Domestically
On the domestic front, the May 2020 position report shows that handlers continue to move pecans through the market and to customers.
For the 2019-2020 recent crop year, the reports show a sharp drop in net shipments starting in October and ending in January. Net shipments are the total pecans received from another handler during that reporting period deducted from the total shipments to retail, grocery, export, other trade sources, and other handlers. When this measure is reported as a deficit, it indicates that individual handlers took in more shipments of pecans from other handlers than they sent directly to grocery, retail, export, other trade sources, and other handlers throughout a particular month.
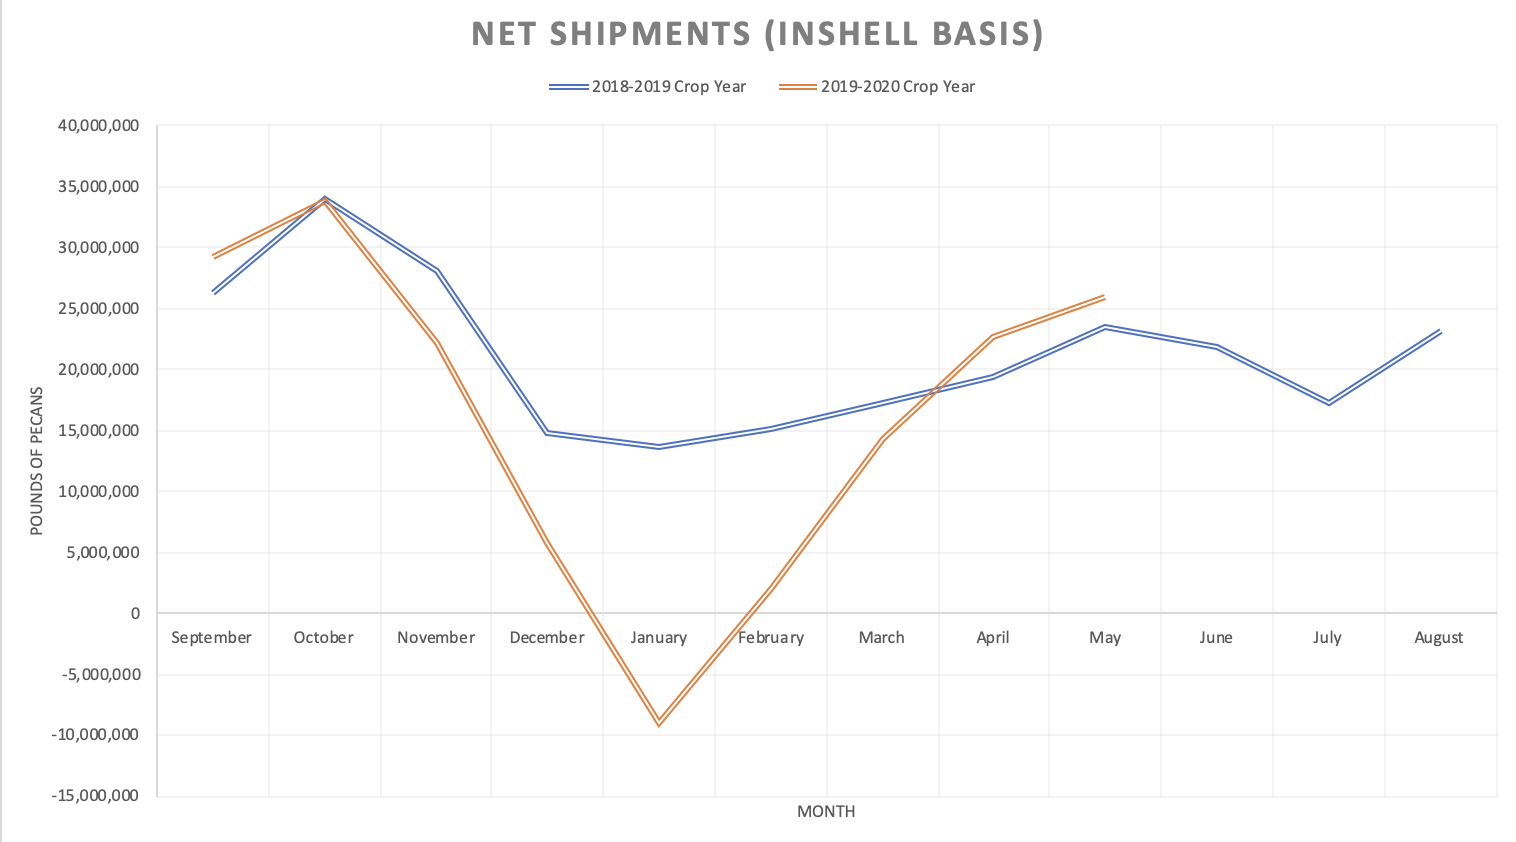
For the current crop year, net shipments dropped into the negatives during January but then began a steady climb in February and through April. In the most recent position report, net shipments continued its upward trend throughout May, reaching 25,977,091 pounds (inshell).
Looking closer at the number, we can see that May saw an increase in shipments to grocery, retail, and exporters for both shelled and inshell pecans. This number’s sharp drop during the beginning of 2020 reflected the movement of pecans between handlers as more nuts came in from harvest and does not reflect how many contracts or deals were arranged during that period.
According to the May 2020 Position Report, net shipments from Sept. 1 to May 31 for the current crop year are 149,235,597 pounds (inshell basis), while the total for that same period previous year sat at 192,367,093 pounds. Just looking at those two numbers from a broader perspective may seem disappointing, but once we look deeper, we can see that handlers received a higher number of pecans from each other and groceries, retails, and exporters took in more pecans—inshell and shelled—during this period. Therefore, the increased movement of nuts between handlers counterbalanced the number sent to stores. These increases ultimately may reflect a larger crop, more demand, and global economic and social uncertainty.
The analysis cannot stop at net shipments to get a complete understanding of how pecans have been moving through the market. We must also look at the reported inventory and commitments.
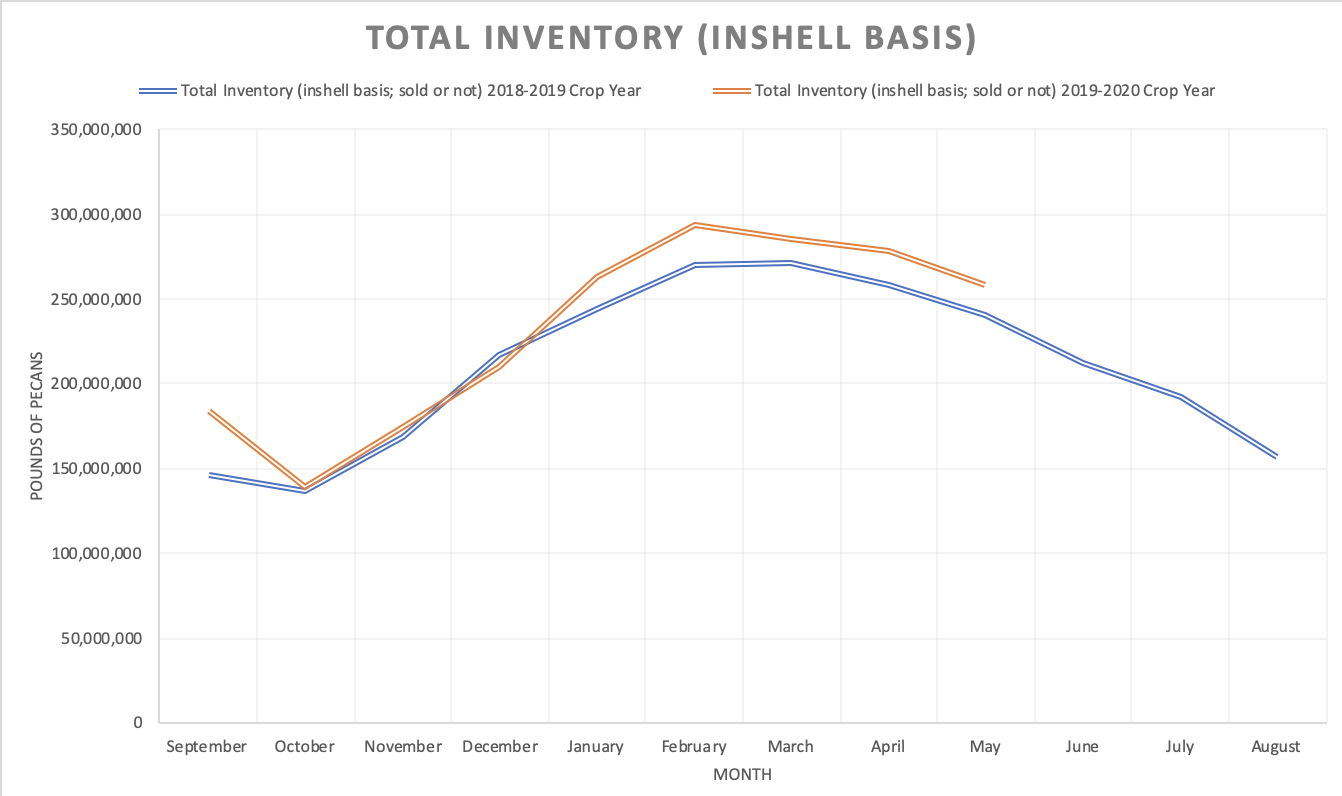
According to the May 2020 Pecan Position Report, total inventory (inshell basis) is up 7 percent from last year at this time. Inventory includes pecans in storage and those contracted for sale. This increase reflects a more abundant crop across the board. Southeastern growers did not endure any major hurricanes or storms in the fall, and their trees were a bit further into their recovery during this last harvest season. Additionally, many western growers reported “on” years, though they did encounter some quality issues from the early freeze. Central producers also brought in a good 2019-2020 crop and escaped the heavy rainfall issues of the previous year.
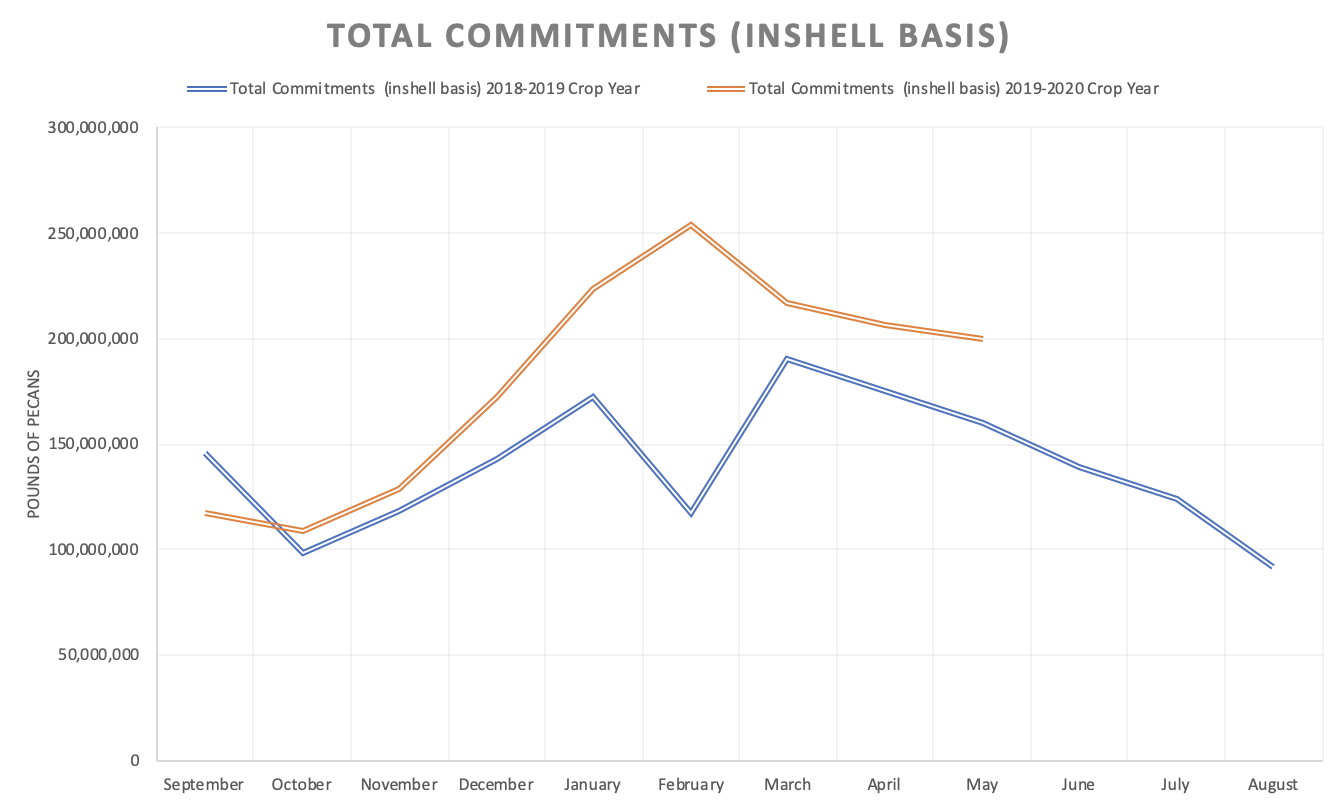
Total commitments—inventory sold, not delivered—remain above the previous crop year’s numbers. The May 2020 Position Report indicated a 25 percent increase in total commitments (inshell basis) for the entire month when compared to last year’s figure. Additionally, the total amount of committed inshell pecans for May 2020 is 141 percent greater than that of the previous year. More committed pecans equal more pecans moved.
For the first time, the May 2020 Pecan Position Report also provides the net open position, which shows what is available in the market. The net open position takes the total inventory figures and deducts the total net commitment figures. At the end of May, 58,121,005 pounds were available for purchase, which is a 28 percent decrease from the previous year. Again, this means that more pecans have been sold or committed by the end of May 2020 than at the end of May 2019.
Looking to the Long Term
As we can all attest to, the pandemic has transformed not only how we live but also how our customers interact with each other, make buying decisions, and eat pecans.
Nielsen reported that in April the majority of American consumers expected the “the spread and intensity of the virus’ impact in their country to increase.” Because of this, new shopping behaviors continued. E-commerce continues to see growth during this time, as most consumers choose to shop online rather than enter the store. Some pecan businesses have reported to Pecan South that they have updated their websites, stores, and social media to meet this demand. Also, Nielsen added that consumers continue to focus on purchasing shelf-stable food and that center-of-store purchases have seen the strongest growth in April and into May.
Around the world, consumers have transitioned to cooking and eating at home more. Nielsen previously reported that when surveyed, 86 percent of Chinese mainland consumers said they would eat at home more post-pandemic. In the United States, interest in the “homebody economy” grew as well, following trends in Asia.
While many countries continue to move out of lockdown at the end of June, the United States, China, and others remain in the thick of it. Consumers remain in the beginnings of a “new normal” and show increased interest in maintaining their health.
Pecans are ideally situated to become part of this new normal. Nutrient-dense, versatile, and shelf-stable, this tree nut can meet the demands of the world’s new normal.
You can find the newest report and all previous reports online on the “Analytics, Data & Market” page on americanpecan.com. For a full break down of last year’s crop and how data is collected, check out the article “What’s Around the Bend for Industry Data and Analytics” from the October 2019 issue of Pecan South.
