On-Farm Recharge on orchard replenishes groundwater
Two-year pilot study shows water can be recharged at a high rate without causing observable harm to tree health and yield.
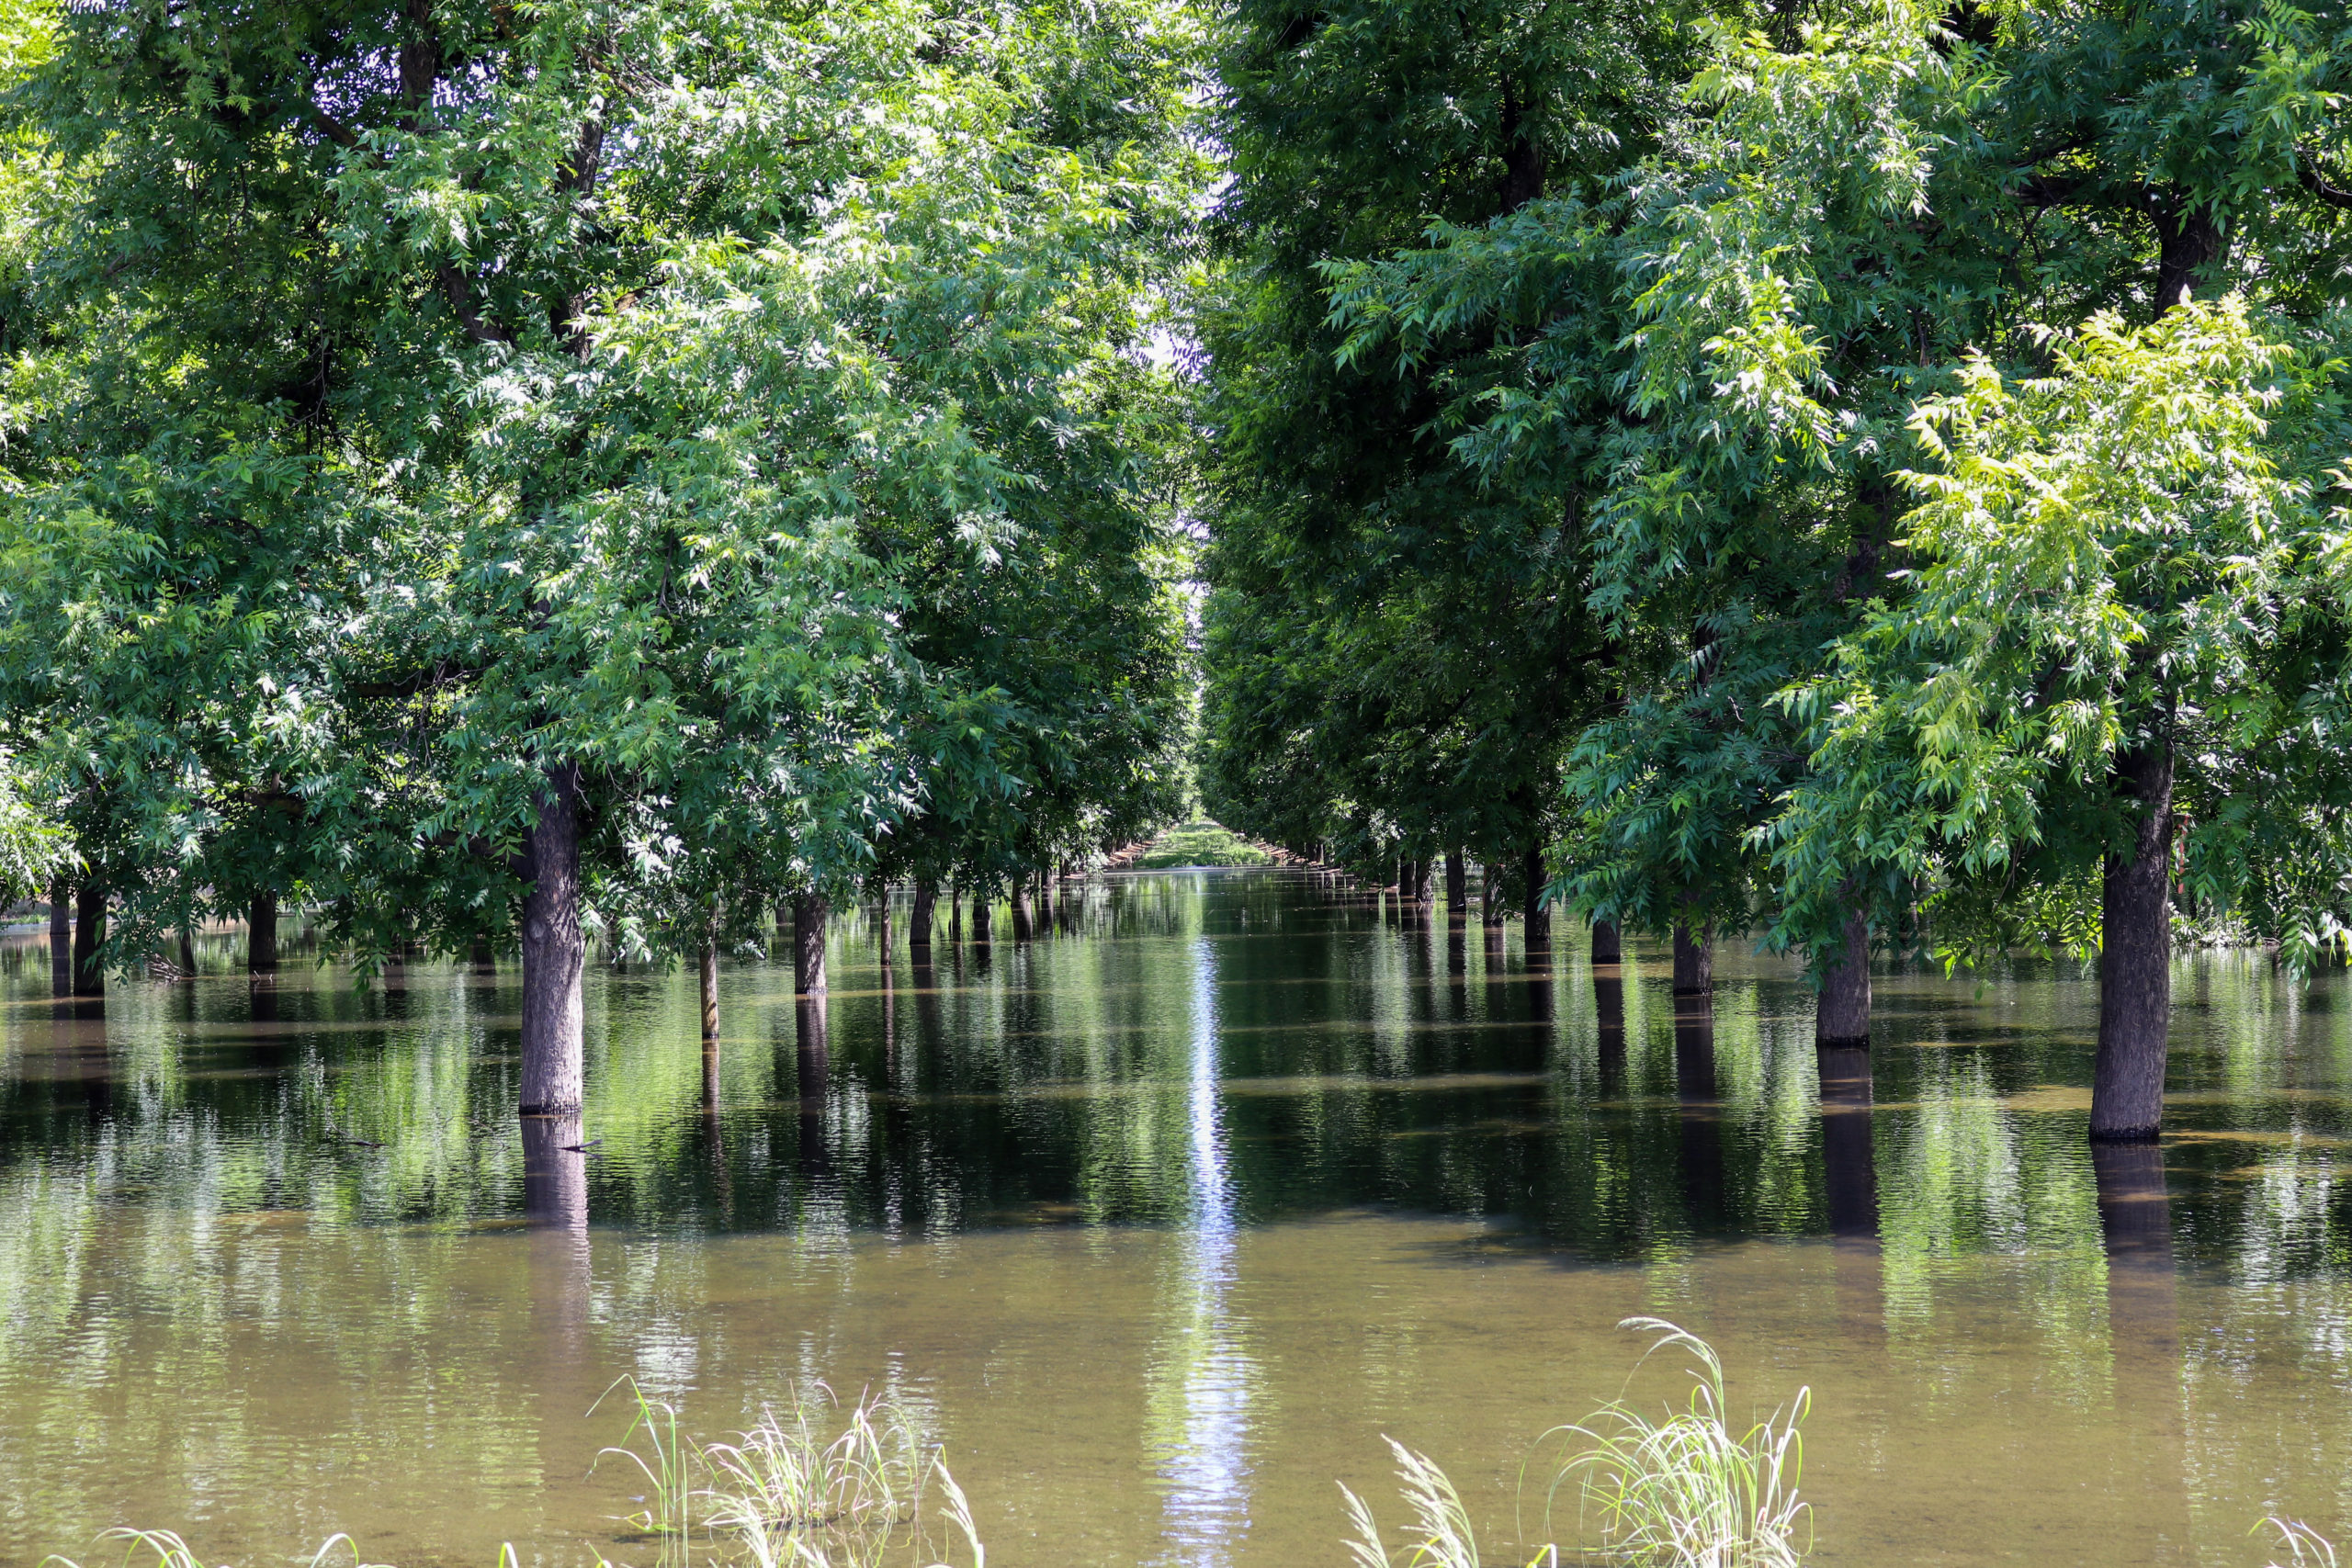
The pecan orchard in Colusa, California flooded for an on-farm recharge demonstration. (Photo by Mohammad Yaghmour)
We conducted an on-farm recharge (OFR) demonstration study on a pecan orchard with 48 trees per acre underlain by sandy loam in California’s southern San Joaquin Valley. The orchards contain trees of different ages, with the majority first planted about 40 years ago and younger trees then planted between each older tree about 12 years ago.

The flooded pecan orchard used for the on-farm recharge demonstration. The orchard has 48 trees per acre underlain by sandy loam in California’s southern San Joaquin Valley. (Photo by Sandra Bachand)
In 2019 and 2020, plots were subjected to flooding for 39 to 46 days from early May to mid-June. In Field 19, plot 19W (5.4 acres) was continuously flooded, and plot 19E (10 acres) was flooded by alternating water between two subplots. In Field 20, 20E (10.6 acres) was over-irrigated for OFR (2020 only) and 20W (23.5 acres) was regularly irrigated. Applied water ranged from 0.8 acre-feet/acre (foot) (2019, 20W) for regular irrigation up to 41 feet (220 acre-feet) (2020, 19W) for continuous flooding (Table 1).
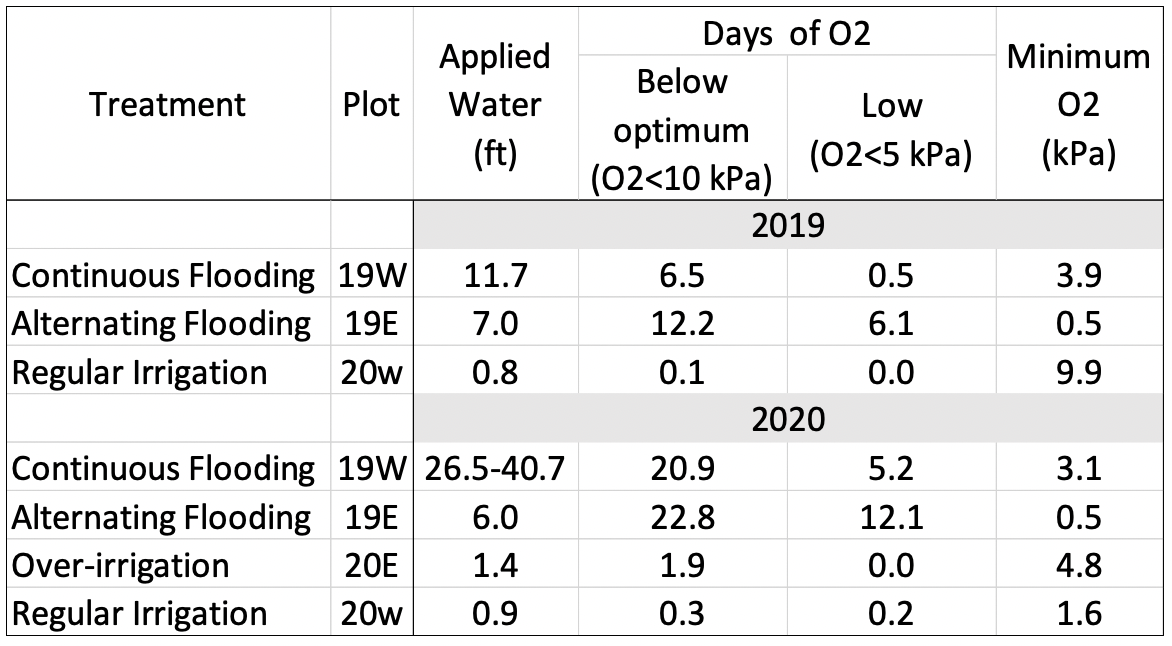
Table 1—Water application volumes (acre-foot/acre), duration of low soil oxygen (O2), and minimum O2 associated with OFR at each treatment plot.
With OFR, soil oxygen fell from near 21 kilopascals (kPa)—the atmospheric oxygen partial pressure at sea level—to levels potentially detrimental to tree health. For nut trees, soil oxygen greater than 10 kPa is optimal, and oxygen below 5 kPa is potentially compromising (University California, 2014). Figure 2 graphs oxygen responses to OFR at plots 19E and 19W. In 2020, oxygen was below 5 kPa at plots 19W and 19E for 5 and 12 days, respectively (Table 1). These oxygen levels could potentially be harmful to tree health. To assess the impact of on-farm recharge on tree health, we evaluated leaf nutrient levels, analyzed stem water potential, assessed trees visually, and compared yields.
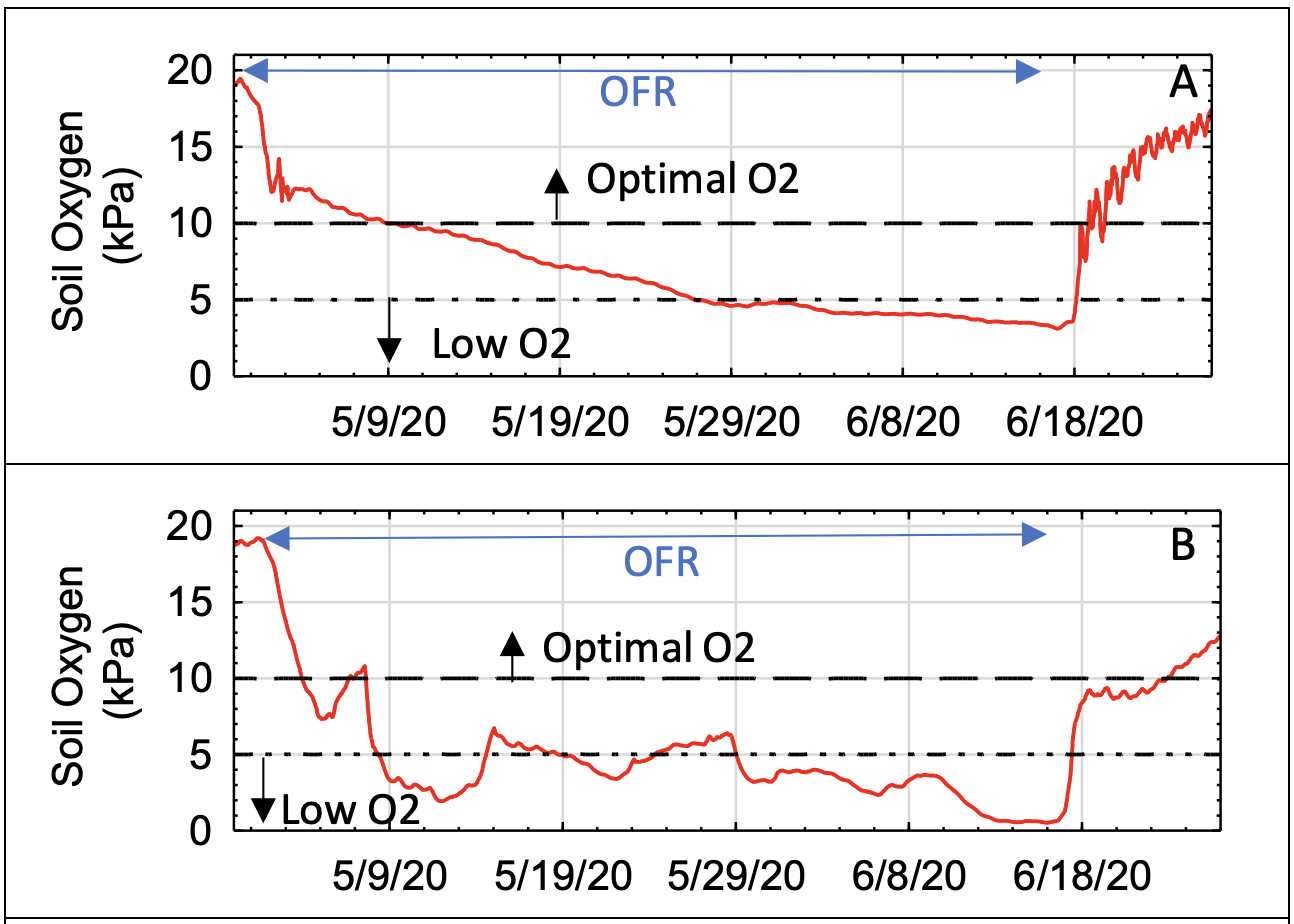
Figure 2—Soil oxygen conditions 1 foot deep during 2020 OFR at continuously flooded treatment 19W (A) and alternately flooded treatment 19E(B). Oxygen tended to stay higher at 19W due to more permeable soil conditions.
Leaf Nutrient Evaluation
The leaf nutrient evaluation was made in 2020. On March 1, 2020, three weeks before leaf emergence, the grower applied 25.7 pounds per acre nitrogen (N), 50.5 pounds per acre potassium (K), and 53.3 pounds per acre phosphorus (P). With expected rapid tree uptake of nutrients at leaf out and during initial leaf growth, nutrients were likely absorbed by OFR initiation on April 30. The grower also applied foliar fertilizer including zinc, boron, nitrogen, and potassium on April 24 and another foliar with zinc and nitrogen by helicopter on June 1.
Leaf nutrient content may reflect soil nutrient availability and root condition. Flooding can flush nutrients out of the root zone, and anoxic conditions can change nutrient availability. Nutrient absorption requires respiratory energy and sufficiently healthy root tissue (Beede, 2005). Kallestad (2007) associated extended flooding with pecan leaf concentrations low in iron (Fe) and Manganese (Mn) and high in chloride (Cl).
We sampled leaves on May 22, 2020, during on-farm recharge and after on June 19, a date generally coinciding with commercial leaf nutrient sampling of local pecans. On both dates, five composite samples of 60 leaflets were taken from 40-year-old ‘Wichita’ trees at each treatment location: 19E, 19W, 20E, and 20W. Samples from 12-year-old ‘Wichita’ trees were also taken at plots 19E and 20W. Leaf sampling and preparation were done in accordance with guidance from Wells (2014), and leaves were rinsed to remove foliar spray residue (Smith et al., 2012) before laboratory analyses.
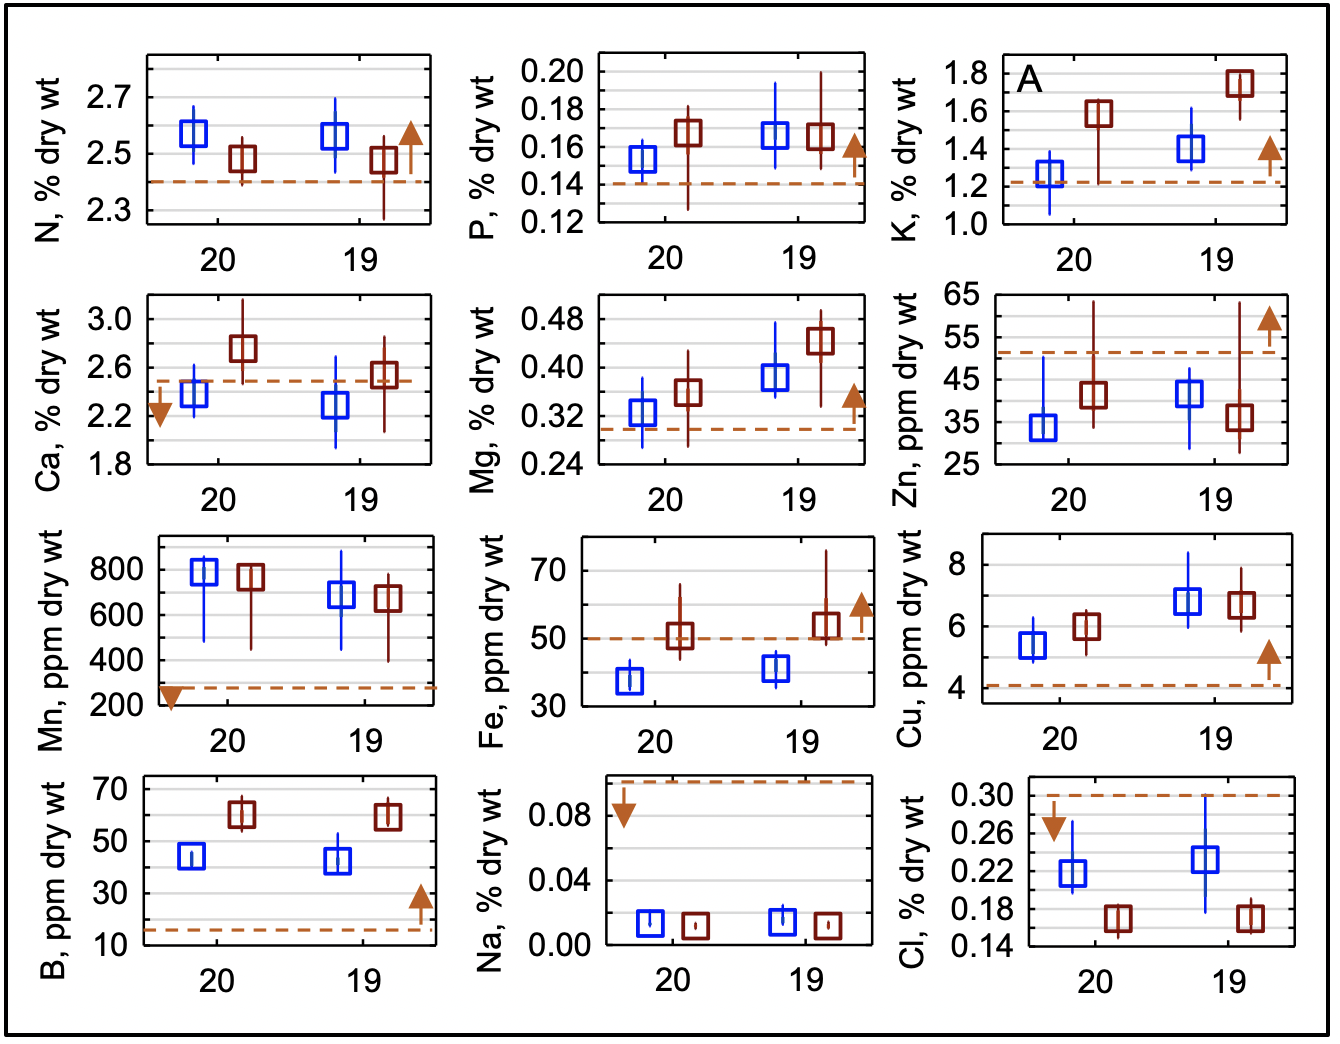
Figure 3—Nutrient content in leaf samples from flooded OFR field 19 and irrigated field 20 indicate little change in plant nutrient status due to OFR. Samples were taken in May 2020(blue) and June 2020 (red). Dashed line is the least conservative nutrient limit suggested by either Heerema (2013), Smith (2012), or Beede, 2012). Boxes-median, bars – 25th-75th quartiles, and whiskers -minimum and maximum.
Nutrient status differed little between tree age or plot within the same field. We, therefore, present results for a 40-year-old tree from flooded OFR Field 19 and irrigated field 20, analyzing for differences in leaf nutrient content and change over time (Figure 3).
Three nutrients—magnesium, copper, and potassium—had consistently higher concentrations in Field 19 (OFR flooding treatments) than Field 20 (irrigations). Higher concentrations in the OFR fields suggest flooding increased nutrient availability in the soil. Potassium, magnesium, and copper concentrations were within the suggested ranges (Heerema, 2013; Smith, 2012; Beede, 2012).
Manganese, phosphorus, and zinc contents suggest flooding hindered these nutrients. Manganese levels tended lower in Field 19 than Field 20 for both sampling dates, with statistically significant differences in June. Phosphorus and zinc increased over time in Field 20 (irrigation) but remained unchanged in Field 19 (OFR), indicating lower uptake under recharge. Despite these trends, June phosphorus and manganese contents were within and higher, respectively, than suggested ranges. Zinc levels were below suggested ranges across all fields and treatments. Calcium, sodium, nitrogen, iron, boron, and chlorine concentrations did not appear affected by on-charge recharge.
Leaf analyses results suggest flooding did not significantly impact tree nutrition.
Stem Water Potential (SWP)
Root physical, pest, or disease damage can inhibit roots’ absorption of water (Shackel, n.d). Stem Water Potential (SWP) measures water tension within the plant. SWP drops and becomes more negative as the soil dries, less water becomes available, and more plant suction is required to draw water from the soil. We compared SWP between on-farm recharge plots (19W & 19E) and the regular irrigation plot (20W). Root damage, potentially caused by recharge, may cause Stem Water Potential to drop even under wet conditions (Lampinen et al., 2015).
In 2020, we measured the SWP of five 40-year-old trees in each treatment and five 12-year-old trees in 19E and 20W using the method described by Fulton et al. (2014). Measurements started May 15 and were made every two weeks until July 9.
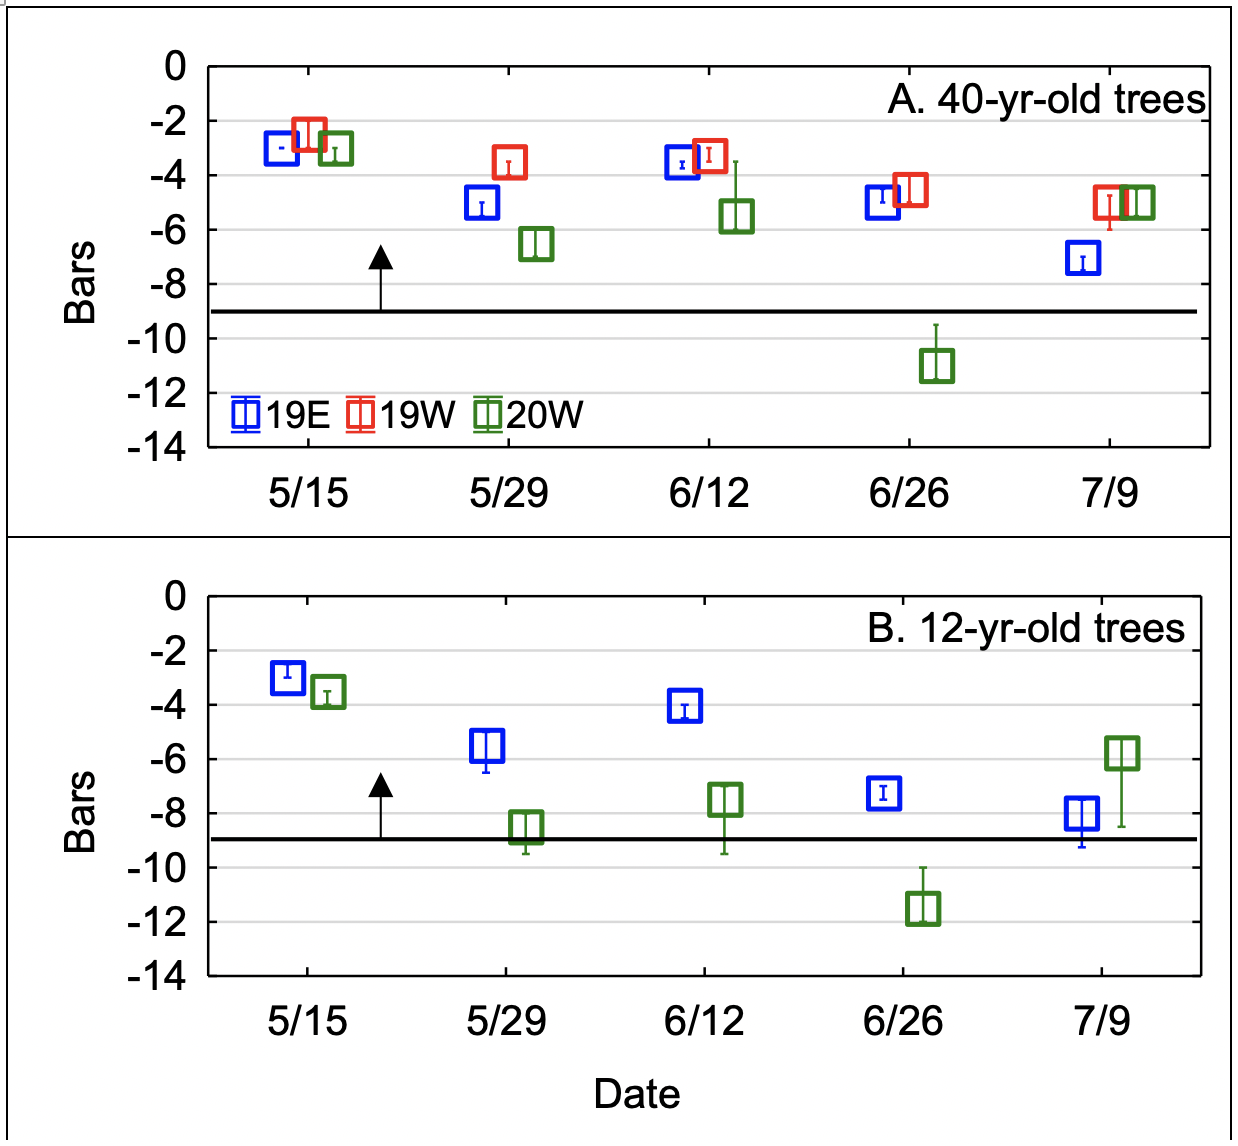
Figure 4—Stem Water Potential stayed above the SWP threshold for pecans associated with reduced photosynthesis (-9 bars) throughout OFR. SWP dropped faster in young trees after OFR was complete. Squares are medians; range is 25 to 75 percent.
During the on-farm recharge period, SWP medians ranged from -2.5 to -7 bars for continuously flooded plot 19W and from -3 to -8 bars for the alternating flooded plot 19E. After the OFR period, SWP dropped, with the decline faster in 12-year-old trees than in 40-year-old trees (Figure 4). However, SWP of both older and younger trees remained above -9 bars, an established threshold to prevent significant reduction in carbon assimilation and photosynthesis in pecan trees (Othman, 2014). Trees in regular irrigation plot 20W were above the threshold for all dates except June 26, 2020, a few days before the plot was irrigated.
These results show pecan roots were healthy enough to absorb water, assimilate carbon, and exchange gases as needed for tree maintenance.
Visual assessment
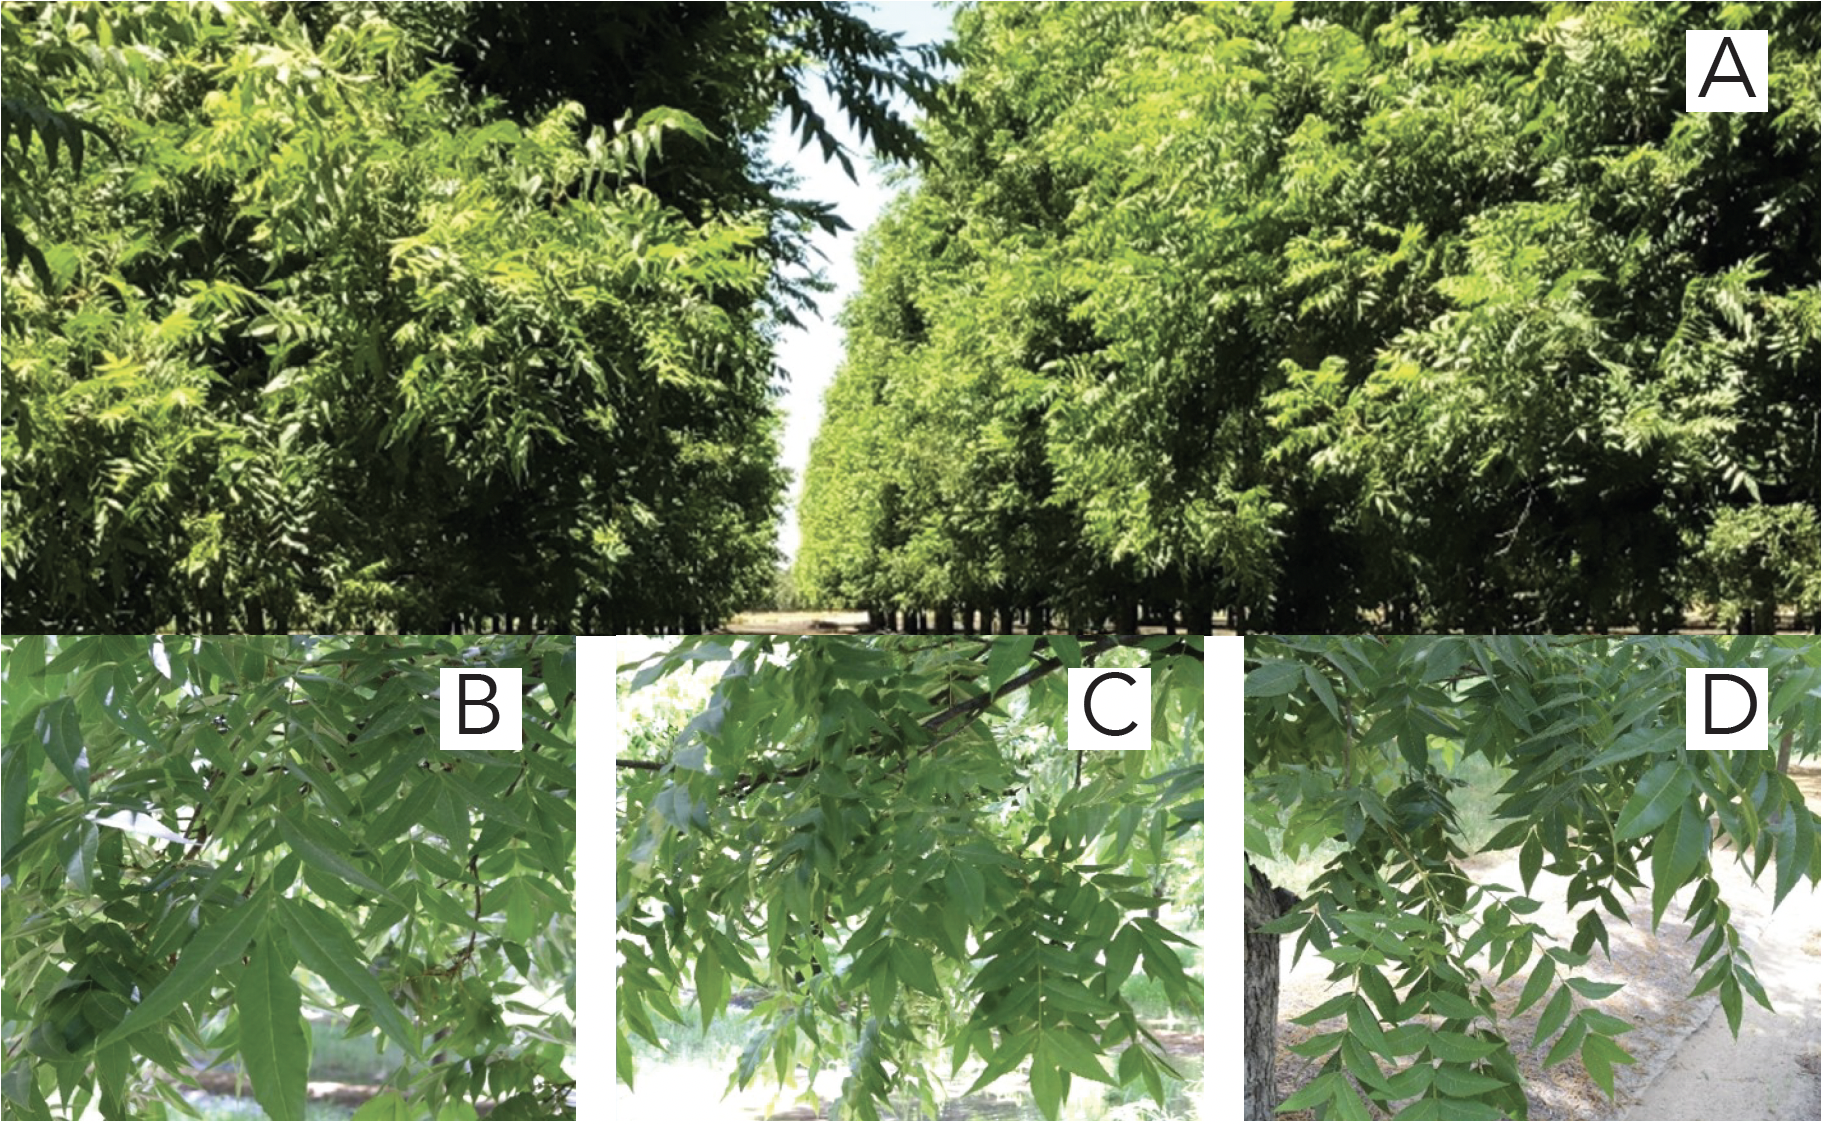
Figure 5—OFR did not result in visual differences between tree color or vigor, as shown in photos taken one to three days after OFR ended in 2020. A) and B) Alternating flooding, 19E; C) Continuous flooding, 19W; D) Regular irrigation, 20W.
In a similar study in New Mexico, Kallestad et al. (2007) observed leaf bronzing and chlorotic and thicker growth in new leaves for 27-year-old trees flooded for 35 days, mid-July to August. In our study in Colusa, California, we did not observe differences in tree leaf color, vigor, or texture between treatments at several site visits made during and after recharge in 2020 (Figure 5). Thus, trees showed no visual signs of decreased health under OFR.
Yield
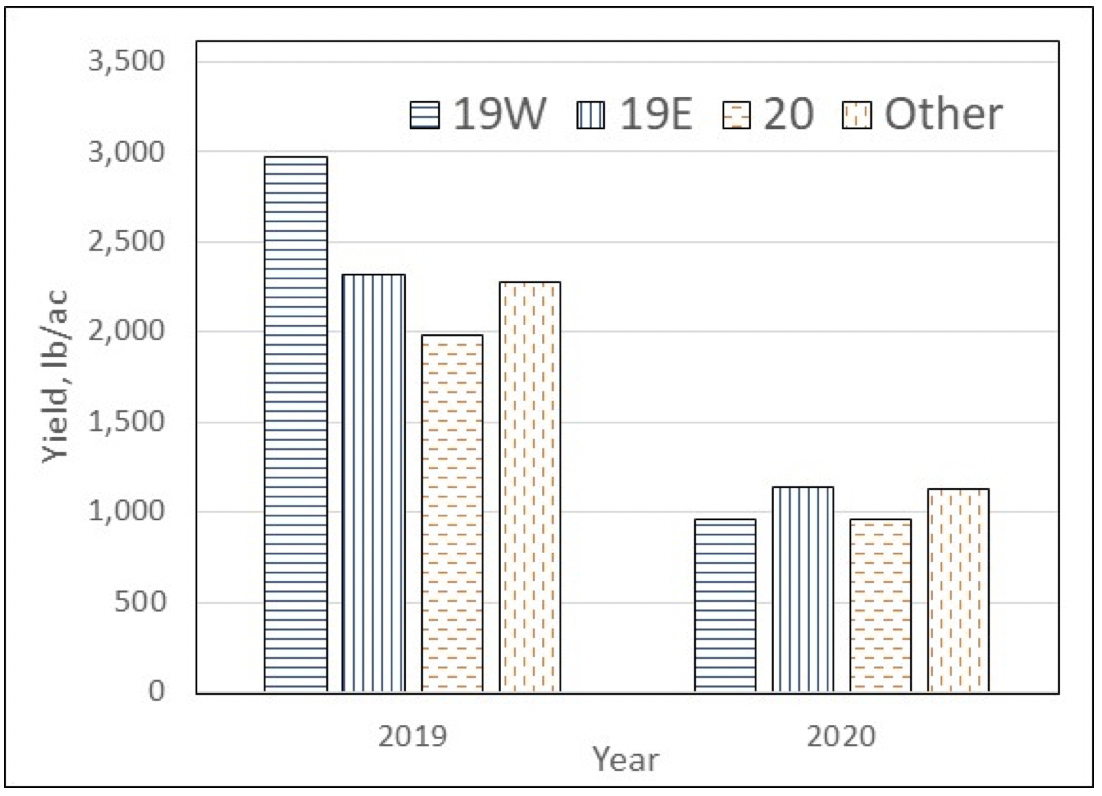
Figure 6—Yields for different plots and fields (‘Wichita’ nut pounds per ‘Wichita’ acres). OFR plots 19W and 19E had similar or higher yields compared to irrigated field 20 and three other orchards adjacent to field 19 (other).
Yield is one of the most important parameters in this pilot study because various occurrences in the current season and previous growing seasons can affect yield. On-farm recharge did not negatively affect yield under the OFR conditions applied in this study. Yields in OFR plots (Field 19) were the same or higher than in irrigated plots (Field 20) and comparable to three other orchards adjacent to Field 19 and under standard irrigation (Figure 6).
Conclusions
Under this pilot study, four tree health measures—leaf nutrition, SWP, visual assessment, and yield—indicate pecan trees remained healthy in 2019 and 2020, up to 46 days under OFR management, even though oxygen fell below 5 kPa for up to 12 days. While this study looked at relatively short-term effects of on-farm recharge on pecan tree health, it is important for future studies to evaluate long multi-year effects and to assess OFR under different soil types.
