Early Season Pecan Inventory Data Shows Rise and Fall
The September 2020 Position Report reflects U.S. handlers' efforts to catch up and decrease large inventory before 2020 harvest.
Image from page 15 of "Armstrong Nurseries" (1942)
Amidst the ongoing battles against the coronavirus, pecan producers continue to shake trees and bring in nuts. But the market has not been there to meet the new crop. Buyers and shellers remain cautious about purchasing new pecans and filling their inventory. The export market has also reportedly had a plodding start. Chinese buyers have been shopping the market, but they haven’t been finalizing deals yet like their American counterparts.
On the other hand, the retail market has performed remarkably well. Growers with small retail shops, retailers, and gift-packing businesses are still filling their inventories and making sales. Most retailers report selling at their usual holiday levels, with some saying they’ve seen more interest this year.
With consumption growing, many industry members have expressed their confusion over the current market situation. These reports shed light on pecans’ movement and patterns.
Pecan Handlers end 2019 with a full inventory
With the 2019 Year-End Inventory Report, the industry now possesses data for four complete crop years. It provides insight into the previous crop year and handlers’ inventory at the start of the current harvest season. According to this year-end report, a total of 230.16 million pounds of U.S. pecans were handled throughout the 2019 crop year. This total marks an increase from the amount handled in the 2018 crop year, which reached 229.21 million pounds but is still lower than the 326.40 million pounds reported in the 2017 crop year.
Through these numbers, industry members can see the reflection of harvest events and experiences. For instance, in 2019, Georgia finished its first year of hurricane recovery; New Mexico brought in around 97 million pounds, and Oklahoma and North Texas lost pecans to an early-season freeze.
The 2019 Year-End Report also includes data on U.S. handlers’ year-end inventory. These inventory numbers represent the amount U.S. handlers had in inventory on Aug. 31, 2020. The report breaks handlers’ inventory down further, including the amount of halves and pieces in storage.
This report’s year-end inventory shows that U.S. handlers held 53,609,758 pounds of uncommitted inshell pecans—improved—on Aug. 31, 2020. For comparison, the 2018 Year-End Report states that handlers had 31,820,470 pounds of uncommitted inshell pecans on that same day in 2019. Therefore, this year’s number for uncommitted inshell pecans marks a 51 percent increase in inventory.
This report also shows a 125 percent decrease in committed inshell pecans to the domestic market in handlers inventory. Although handlers had more pecans committed for export, their total inventory (inshell basis) on Aug. 31, 2020, was 21 percent greater than that held on Aug. 31, 2019. To put it plainly, U.S. handlers entered September with more pecans. Greater pecan inventory could be linked to a decrease in sales due to restaurant and school closures from coronavirus, as well as just a larger crop in general.
Diving further into the 2019 Year-End Inventory Report, industry members will see a new important data point: the Crop Year Average Price Paid. Responding to industry and USDA feedback, the APC continues to adjust the report format and data it publishes. This newest figure is one such adjustment. The Average Price Paid represents the average price U.S. handlers paid for inshell pecans throughout that particular crop year. According to the APC, this figure can include handlers who bought loads from growers or another handler as long as the product remained in the shell. The APC also edited and added this data to the 2018 Year-End Report.
In the 2019 crop year, this year-end report indicates that handlers paid an average price of $1.99 per pound for inshell improved nuts, $1.01 per pound for inshell natives or seedlings, and $0.76 per pound for substandard loads. According to the 2018 Year-End Report, the average price paid per pound by U.S. handlers was $1.74 for improved, $1.18 for natives, and $0.81 for substandard pecans.
The reported price for improved nuts indicates a slight rise from 2018 prices. This increase may link back to several factors. The U.S. and China approached a trade deal; U.S. growers saw less competition from Mexican growers as buyers imported fewer nuts, and consumption and demand increased in the domestic market. The price for natives, on the other hand, reflects growers’ experiences throughout the last crop year. This year growers have also expressed concerns over prices, and accounts suggest that this year’s prices are lower than last’s, but just how low is yet to be seen. Although the Average Price Paid was not available in previous year-end reports, it does prove useful to the industry and will only become more so as the years progress.
Rise in shipments but not commitments
Around the time the APC released the 2019 Year-End Report, it also published the September 2020 Position Report, the first for the current crop year. Through the year-end report, industry members can see that U.S. handlers entered the current harvest season with a greater amount of inventory and uncertainty as the pandemic continues. With this in mind, the September 2020 Position Report shows what happened once the season started and how handlers responded to their inventory.
Potentially the most important data point within these position reports is the Net Open Position. The Net Open Position shows the number of nuts available for sale within inventory—i.e., not contracted. It takes the total inventory and deducts the total net commitment figures. According to the August 2020 report, the Net Open Position on Aug. 31, 2020, was 62,934,485 pounds; this is a 29 percent decrease from the Net Open Position at the end of August 2019. The September 2020 report shows a 41 percent decrease in the Net Open Position figure from 2019 to 2020. This decrease means that U.S. handlers had fewer uncommitted pecans at the end of September than they did the previous year.

Total Inventory (inshell basis) reported in the monthly Pecan Position Reports from the American Pecan Council for 2018, 2019, and 2020 crop years.
When thinking about the Net Open Position, it is essential that one also examines total inventory and net commitments. Total inventory includes pecans contracted for sale and those in storage; this figure only encompasses pecans held by U.S. handlers, not those stored by growers. For most of the 2019-2020 crop year, U.S. handlers reported more inventory than in 2018-2019. Several factors possibly attribute to this rise, including New Mexico’s large crop, new bearing acreage, and an “on” year in several states.
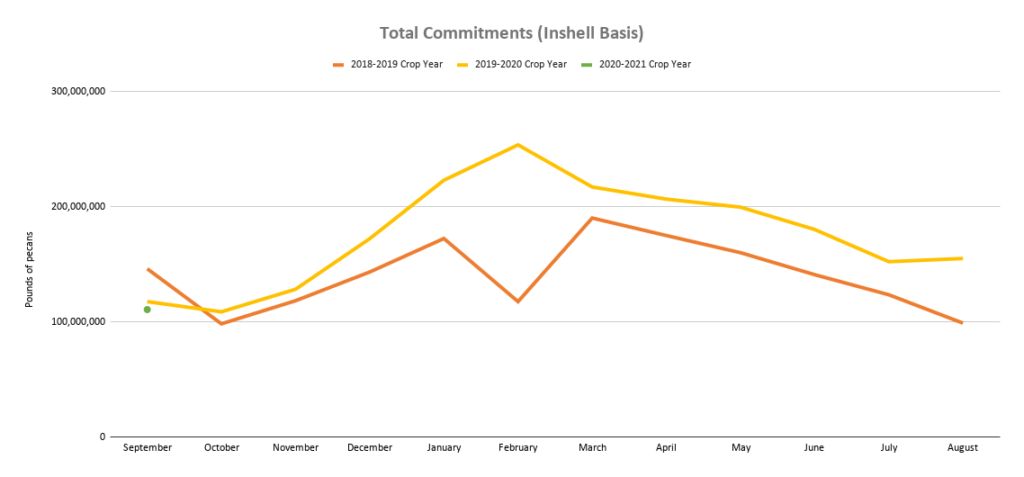

The APC defines net commitments as the inventory sold but not yet delivered. This year’s other position reports showed a spike in net commitments in February 2020; handlers had pecans sold but had not shipped them yet. Once the pandemic hits and lockdowns begin globally in March, net commitments almost plateau. In the 2018-2019 crop year, net commitments (inshell basis) peaked in March 2019 and then declined through August. This is not the case for the 2019-2020 crop year.
According to the 2019 Year-End Inventory Report, U.S. handlers held 82,635,237 pounds (inshell basis) of uncommitted pecans at the end of August 2020. This number is about a 25 percent increase from the total uncommitted inventory handlers had at the end of August 2019.
Yet, the September 2020 report indicates that net commitments at the end of September were slightly lower than reported in 2019. This report also shows that total inventory that month fell below 2018-2019 crop year levels. September 2020 also exhibits a 77 percent increase in total shipments.
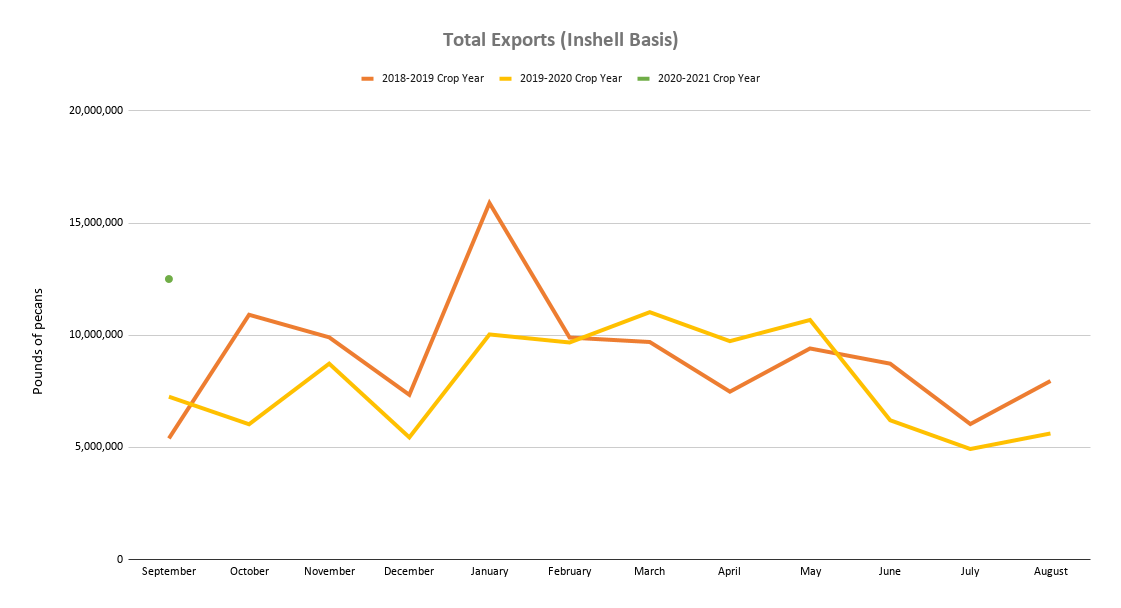
Total Exports (inshell basis) reported in the monthly Pecan Position Reports from the American Pecan Council for 2018, 2019, and 2020 crop years.
According to the most recent position report, total exports (inshell basis) for September 2020 were 12,510,205 pounds. This total marks a 53 percent increase from the previous year. The report also shows an increase in pecans going to China this month. In September 2019, total exports headed to China were reported to be around 1.4 million; for September 2020, handlers sent approximately 4.81 million pounds of pecans to China. Vietnam and South Korea also saw an increase in exports for September 2020 compared to that same month last year.
Total exports to Europe are down 72,240 pounds (inshell basis). While some European countries showed a decrease in pecans received, Belgium, France, Netherlands, Switzerland, and the United Kingdom all exhibited increases for September.
By looking at September’s total exports, inventory, and shipments, pecan industry members can use this data to better understand market situations. These latest reports indicate that U.S. handlers entered the 2020 crop year with more inventory and more pecans contracted for sale than the last, but they were still playing catch up in regards to shipments and exports. In September, we can see the results of handlers’ efforts to finalize contracts, move shipments, and decrease their inventory before new crop comes in. The question though is whether this pattern continued through October and November. Although recent accounts suggest a nonexistent market, future position reports may provide—if not answers—at least a glimpse as to why that may be the case.
All position reports can be found online on the “Reports” page at AmericanPecan.com. For a full breakdown of last year’s crop and how data is collected, check out the article “What’s Around the Bend for Industry Data and Analytics” from the October 2019 issue of Pecan South. The October 2020 Position Report was published the evening of Dec. 1, 2020, after Pecan South released this article. Stay tuned for analysis on that data.
Editor’s Note: numbers and charts were updated on Dec. 2, 2020, when the APC updated the September 2020 Position Report.
